Enzymes Graphing Activities
- Zip
- Google Apps™
- Microsoft OneDrive

What educators are saying
Also included in
- Five of my best-selling complete teaching bundles are included in this one Super-Mega-Bundle! This bundle includes all of the PowerPoints, notes, labs, task cards, homework assignments, review games, quizzes, activities, and unit tests that you need to teach complete and comprehensive units on cellPrice $189.99Original Price $268.09Save $78.10
- This complete teaching bundle on Enzymes, Catalysts, and the Chemical Reactions of the Cell teaches important concepts such as the role of enzymes in cells, activation energy, substrates, active sites, and the lock and key hypothesis of enzyme functioning. Detailed list of topics is found below.It'sPrice $29.99Original Price $39.73Save $9.74
- This NO PREP, PRINTABLE, EDITABLE, AND DIGITAL Biology Curriculum contains everything you need for an entire year of Biology! For less than $3 a day, you can save your time, energy, and sanity. Each of the 20 Complete Units includes a teaching PowerPoint presentation, notes, labs, homework assignmenPrice $525.00Original Price $988.18Save $463.18
Description
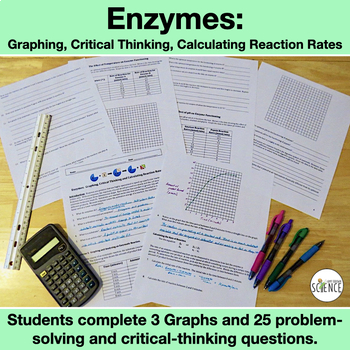
This is a 6-page editable graphing activity for students on enzymes and the reaction rates of chemical reactions that occur within living cells. Students will calculate reaction rates and answer questions on vocabulary such as activation energy, substrate, and active site. Students will complete cause and effect questions about the effect of temperature and pH on the functioning of enzymes. This activity serves the dual purpose of reinforcing concepts about enzymes as well as an "always needed" review of graphing. The student will complete 3 separate graphs. Critical thinking and thought provoking questions follow each graph. Choose to use the traditional printable version, or the paperless, digital Google Apps version.
What is included in this resource?
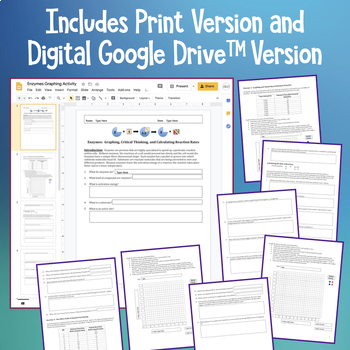
- Editable and Printable 6-page student handout
- Paperless Digital Version (not editable) for use in Google Drive, Google Classroom, and /or Microsoft OneDrive
- Teacher Guide and Answer Key
- Google Apps Teacher Guide
This graphing activity was written to accompany my Enzymes Powerpoint which can be viewed by clicking the following link:
Enzymes and the Chemical Reactions of the Cell PowerPoint and Notes.
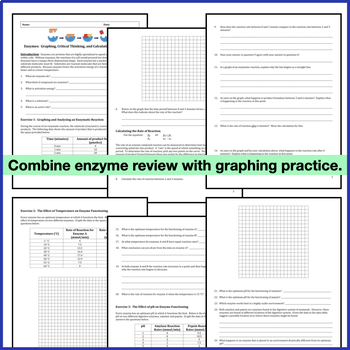
The activity begins with the student answering 5 questions about enzymes. It is assumed that the instructor will have already taught a lesson on enzymes. This introduction is followed by three graphing exercises:
Exercise 1: Graphing and Analyzing an Enzymatic Reaction
The student is given data on the amount of product produced over time during an enzymatic reaction. The student will graph the information, and calculate the rate of reaction at various time intervals. There are 9 follow-up questions in this section.
Exercise 2: The Effect of Temperature on Enzyme Functioning
The student is given data on the reaction rate of an enzyme-catalyzed reaction taking place over a range of temperatures. The student will complete the graph and answer 6 questions.
Exercise 3: The Effect of pH on Enzyme Functioning
The student is given data on the reaction rate of an enzyme-catalyzed reaction taking place over a range of pH levels. The student will complete the graph and answer 5 questions.
The 6-page student activity is set up so that students can graph and answer the questions directly on the handouts. Grids are provided for graphing. To save paper you can easily print a classroom set and have students complete the work on their own notebook paper and graph paper.
This document also includes a very detailed 5-page teacher answer guide.
This activity has served me well as a homework assignment, test review or classroom work. I often keep a copy of this in my emergency sub folder. It makes a great activity for students to complete in my absence.
This activity was written for my high school biology classes. It is appropriate for all biology and life science classes in grades 9 through 12.
Related Products Include:
- Enzymes Complete Teaching Bundle
- Enzymes and the Chemical Reactions of the Cell PowerPoint and Notes
- Enzymes and Catalysts Homework / Study Guide
- Enzymes Task Cards
- Lab: Cells, pH and Buffers
- Lab: The Effect of the Enzyme Amylase on Starch
- Lab: The Release of Heat in an Enzymatic Reaction
- LAB - Catalase: An Enzyme Common to Both Plants and Animals
- Enzymes, Catalysts and Chemical Reactions Crossword Puzzle
- Enzymes Graphing Activities
- Enzymes and Catalysts Quiz / Test
- Enzymes and Catalysts: Jeopardy Review Game
- Graphing and Data Analysis Worksheet and Quiz Set
For updates about sales and new products, please follow my store:

