Earthquake Volcanoes Tectonic Plates Plotting Activity
- PDF
- Google Apps™

What educators are saying
Also included in
- Looking for fun, student-centered, and engaging activities to add into your Earth Science curriculum? This is all of my resources for teaching Earth Science! This is a bundle of engaging resources including editable NGSS-aligned blended learning units, Cornell Doodle Notes, digital Pixel Art contentPrice $223.00Original Price $316.63Save $93.63
- This is a bundle of all of my resources for teaching Earth and Space Science at the middle school level! These resources include a mix of Cornell Doodle Notes, lab activities, inquiry activities, digital lessons and units, projects, and pixel art digital content review activities.✨ Please note thatPrice $313.00Original Price $449.76Save $136.76
- This is a bundle of all of my resources for teaching Earth and Space Science at the middle school level, EXCLUDING the Cornell Doodle Notes. The resources in this bundle include a mix of digital lessons and units, lab activities, inquiry activities, projects, review activities, and assessments.✨ ThiPrice $259.00Original Price $369.00Save $110.00
Description
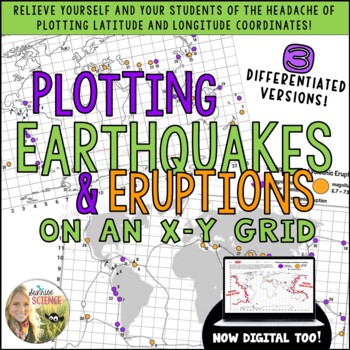
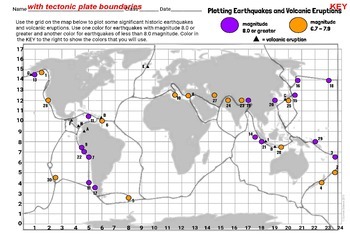
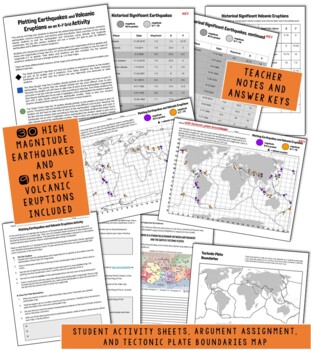
This activity will help your students to discover the relationship between the location of Earth’s earthquakes, volcanic eruptions, and tectonic plate boundaries. Most activities of this nature require students to plot the earthquakes and volcanoes using latitude and longitude coordinates, but for this version, students will use a simple X-Y grid to plot 30 different earthquakes and 9 different volcanic eruptions.
Students will choose two colors to represent earthquakes with magnitudes of 8.0 or greater and those with magnitudes of less than 8.0. All of the 30 earthquakes included on the list were of magnitude 6.7 or greater. Their dates and locations are also included. For the volcanic eruptions, students will use a triangle symbol ( ▲ ) on their maps.
There are three differentiated versions of the maps and earthquake lists to accommodate your different learners.
For the second part of the activity, students will trace the Earth's tectonic plate boundaries onto their maps and make at least three observations of their map. They should notice that the earthquakes occur over or very close to the boundaries, that many of the strongest earthquakes happened along the coast of Chile and in Indonesia. They should notice that many of the plotted quakes appear to be in lines, that many occurred along the edges of continents, and that certain places do not have any major earthquakes, like Africa and Northeastern America.
Next, students will write an argument supported by evidence to respond to this claim: There is a strong relationship between earthquakes and the earth’s tectonic plates. The students should use their own Plotted Earthquake Map as well as the Plate Boundaries map included on the assignment page to support their argument with evidence.
For the next part of the activity, students should plot the volcanic eruptions from the data table. These are 9 of the most deadly or destructive volcanic eruptions in history and make at least three observations about their locations. Lastly, play the suggested video clip to show the students the location of the Pacific Ring of Fire. The students should use a highlighter to highlight the Ring of Fire and use this to answer two questions about the types of plate boundaries most prevalent around the Ring of Fire.
I made this activity for my 6th graders and the differentiated versions helped me to facilitate this lesson with all of my students at the same time without having some students blow way ahead of the others and without some students taking a lot longer to plot the points than others and feeling frustrated. At the end of the activity, everyone understood the big ideas and had a map that they felt proud of!
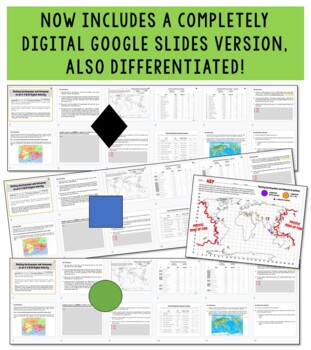
Digital Version Included: This resource now includes links to make copies of the black diamond (highest), blue square (medium), and green circle (lowest) DIGITAL GOOGLE SLIDES versions of this activity. These versions have been designed in Google Slides and can be facilitated through your Google Classroom!
You may also be interested in these resources:
Earthquakes and Volcanoes Blended Learning Unit
Earth's Interior and Plate Tectonics Blended Learning Unit
Plate Tectonics Cornell Doodle Notes and Presentation
Plate Tectonics Abracadabra Pixel Art Digital Review Activity
Thanks for looking!
Sunrise Science

