Dot Plots and Data Distribution Notes
OptimizED for Learning
171 Followers
Grade Levels
5th - 7th
Subjects
Resource Type
Standards
CCSS6.SP.B.4
CCSS6.SP.B.5d
Formats Included
- PDF
Pages
4 pages
OptimizED for Learning
171 Followers
What educators are saying
I have never thought to use feet to explain non symmetrical displays of data. What a great way to engage the learners and give them a way to never forget skewed left and skewed right! I will definitely be using this resource next year.
Description
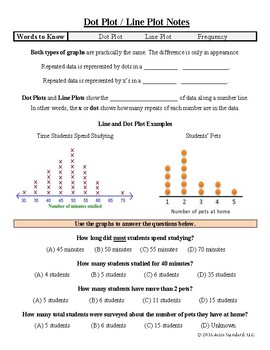
A visually appealing and interactive way to teach about dot plots, line plots and the distribution of data. Both reading and creating dot/line plots is addressed on the first page of the notes. The entire second page is dedicated to describing the shape of the data. From bell curves to skewed left or right, dot plots are used to describe statistical elements of data sets.
Actis Standard notes are a great way to teach students how to take notes in an easy to follow fill-in-the-blank format. Complex vocabulary and concepts are simplified and made attainable for all students. In essence, the notes are designed to address essential information and make it visually appealing. Your students will actually enjoy filling in the notes!
The license is intended for one teacher and all of their classes. Please purchase additional licenses for each additional teacher planning on using these materials in your building. Thanks! If you like what you see, please follow the Actis Standard store. New materials are posted frequently.
Looking for additional practice? Check out "Dot Plots / Line Plots Practice" in my store. These practice pages even come with a free tutorial video built right into the page (QR code) to help your students when they get stuck or want to verify that they are practicing correctly.
Total Pages
4 pages
Answer Key
Included
Teaching Duration
N/A
Last updated Jul 26th, 2017
Report this resource to TPT
Reported resources will be reviewed by our team. Report this resource to let us know if this resource violates TPT’s content guidelines.
Standards
to see state-specific standards (only available in the US).
CCSS6.SP.B.4
Display numerical data in plots on a number line, including dot plots, histograms, and box plots.
CCSS6.SP.B.5d
Relating the choice of measures of center and variability to the shape of the data distribution and the context in which the data were gathered.


