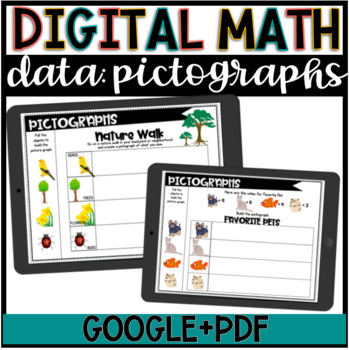
Digital Math//Pictograph Activity//Google Slide//DISTANCE LEARNING
- PDF
- Google Apps™

Also included in
- Digital and remote learning is a reality. Need a digital math resource for understanding and interpreting graphs? Here is a bundle of them!! This resource will help students interpret data in a digital way! Read and answer questions about bar graphs, build bar graphs, and pictographs! An array of daPrice $4.50Original Price $6.50Save $2.00
Description
Digital and remote learning is a reality. If you are using Google Slides for your remote learning leads, this is a great activity for data: pictograph length practice. This also makes a great math graphing center!! Data and Measurement plus graphing for distance learning!
Need more Google slide resources? CLICK HERE!
What is it?
5 data graph activities asking students to use pictures to build pictographs (picture graphs). 2 of the graphs are for students to go on their own data-collecting adventure through a nature walk and house hunt. The other graphs give them a set of data to display with the graph. Finally, they get a blank graph to build their own!
This resource includes the slides in PDF for printing
AND a link to a copy of the Google slides to be assigned to students through Google classroom.
Not using Google classroom but still need a digital option? Try Nearpod.com. Just upload the slides to Nearpod, transform each to "Draw it" slides and save the lesson.
For more, check out the blog HERE!
----------------------------------------------------------------------------------------
Did you know you can earn TPT $ as store credit just by leaving feedback?
Here's how:
Go to the “My Purchases” page.
Use the provide feedback icon under any item you downloaded.
Click it and you will be able to leave a short comment and rating.
Each time you provide feedback TPT gives you credits that you may use to lower the cost of any future purchases.
It’s that easy!
Thank you in advance as your feedback is important to me!
----------------------------------------------------------------------------


