TPT
Total:
$0.00

Different Types of Graphs Book

Rated 4.83 out of 5, based on 359 reviews
4.8 (359 ratings)
;
Create-Abilities
46.9k Followers
Grade Levels
Not Grade Specific
Standards
Formats Included
  • PDF
Pages
26 pages
$4.00
$4.00
Share this resource
Report this resource to TPT
Create-Abilities
46.9k Followers

What educators are saying

My students were able to follow along as we went over each type of graph and then kept this book to look back on while moving through our graphing unit. Nice variety of graphs shown and practiced in this booklet and resource too.
This was a great product for reviewing the different types of graphs before standardized testing. I think that it really helped my students to remember them all before the "big test".

Description

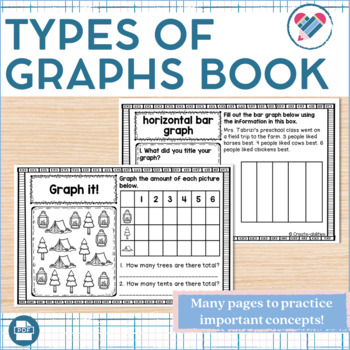
This 26 page pack gives your students many different opportunities to learn about and identify different types of graphs. They will also create and draw their own graphs. The book is half page to help with printing, copying, and stapling. The size also helps students be able to store them inside their desks or folders for easy access to this information. Teaching this important measurement concept has never been easier or more fun!

Many Different Types of Charts and Graphs to Deepen Your Student's Understanding

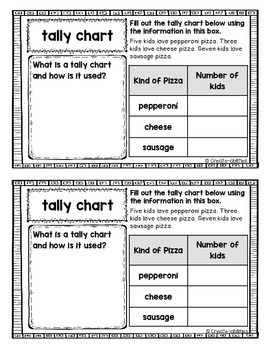
• tally charts

• circle graphs

• bar graphs

• horizontal bar graphs

• line graphs

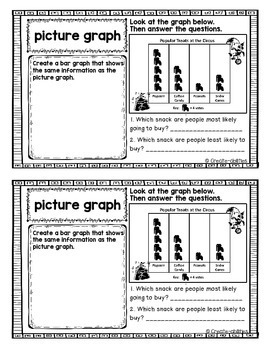
• picture graphs

• line plots

• scatter plots

• graphing based on pictures

Put the Learning Back in the Hands of Your Students

Students create their owns graphs and answer questions about each type of graph.

These pages can be printed out and stapled into a book for students to fill in as an assessment, review, homework, math centers, and more! Your students will love having all of this critical information right at their fingertips.

Check out my preview for a closer look at this product!

Feedback is greatly appreciated!!

★★★★You Might Also Like★★★★

Measurement Little Book

Fractions Little Book

Line Plots 2.MD.9

Line Plots 4.MD.4

Total Pages
26 pages
Answer Key
N/A
Teaching Duration
N/A
Report this resource to TPT
Reported resources will be reviewed by our team. Report this resource to let us know if this resource violates TPT’s content guidelines.

Standards

to see state-specific standards (only available in the US).
Organize, represent, and interpret data with up to three categories; ask and answer questions about the total number of data points, how many in each category, and how many more or less are in one category than in another.
Generate measurement data by measuring lengths of several objects to the nearest whole unit, or by making repeated measurements of the same object. Show the measurements by making a line plot, where the horizontal scale is marked off in whole-number units.
Draw a picture graph and a bar graph (with single-unit scale) to represent a data set with up to four categories. Solve simple put-together, take-apart, and compare problems using information presented in a bar graph.
Draw a scaled picture graph and a scaled bar graph to represent a data set with several categories. Solve one- and two-step “how many more” and “how many less” problems using information presented in scaled bar graphs. For example, draw a bar graph in which each square in the bar graph might represent 5 pets.
Generate measurement data by measuring lengths using rulers marked with halves and fourths of an inch. Show the data by making a line plot, where the horizontal scale is marked off in appropriate units-whole numbers, halves, or quarters.

Reviews

Questions & Answers

46.9k Followers