TPT
Total:
$0.00

Data and Statistics Resource For Middle School | March Madness

Rated 4.67 out of 5, based on 15 reviews
4.7 (15 ratings)
;
Katie May
804 Followers
Grade Levels
6th - 8th
Resource Type
Standards
Formats Included
  • PDF
Pages
34 pages
$4.50
$4.50
Share this resource
Report this resource to TPT
Katie May
804 Followers

Description

Welcome to the BEST March Madness product on the market for Data and Statistics!

Do you love providing real world applications to your math students? Do your students get excited for friendly competition and real world research? Are you looking for something to take you beyond the textbook?

If you answered yes, this is the data and statistics resource bundle you are looking for!

Click Here to Follow Me and Learn about New Products!

All new products are 50% off for the first 24 hours!

This resource bundle has:

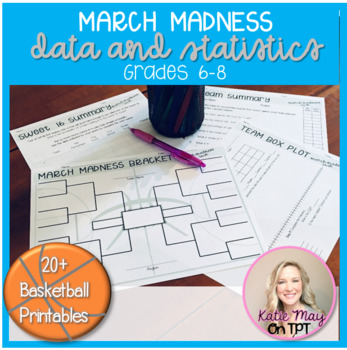
- Over 15 data and statistics printables themed for basketball (March Madness)

- An overview of the interactive and real world March Madness Task

- 6 classroom posters for the March Madness Task

- 3 accompanying worksheets to guide students through data collection and analysis for the March Madness NCAA tournament

- 1 Blank March Madness Bracket for students

- 1 Classroom Score Card

Topics Included:

- dot plots

- histograms

- box plots

- scatter plots

- comparing box plots

- random sampling

- measures of center and variation

- mean absolute deviation

- probability

- single event probability

- compound event probability

- theoretical vs experimental probability

- line of best fit

- two way tables

Check out my BOX PLOTS FREEBIE that is a part of this resource!

Total Pages
34 pages
Answer Key
Not Included
Teaching Duration
N/A
Report this resource to TPT
Reported resources will be reviewed by our team. Report this resource to let us know if this resource violates TPT’s content guidelines.

Standards

to see state-specific standards (only available in the US).
Recognize a statistical question as one that anticipates variability in the data related to the question and accounts for it in the answers. For example, “How old am I?” is not a statistical question, but “How old are the students in my school?” is a statistical question because one anticipates variability in students’ ages.
Understand that a set of data collected to answer a statistical question has a distribution which can be described by its center, spread, and overall shape.
Recognize that a measure of center for a numerical data set summarizes all of its values with a single number, while a measure of variation describes how its values vary with a single number.
Display numerical data in plots on a number line, including dot plots, histograms, and box plots.
Summarize numerical data sets in relation to their context, such as by:

Reviews

Questions & Answers

804 Followers