
Data and Graphing Lessons for Guided Math | 2020 Ontario Math | CCSS


- Zip
Also included in
 This bundle of Differentiated Guided Math Lesson Plans is everything you need to teach small-group math lessons and assess student learning while the rest of your class works on independent centers! ⭐ These guided math lessons are also available in a Mega Bundle with my guided math centers and digitPrice $120.00Original Price $150.00Save $30.00
 These hands-on guided math data and graphing lessons and centers will engage students in authentic, meaningful learning activities while you work with student groups! These best-selling math centers and lessons are a must-have for your classroom!⭐ The data and graphing activities in this bundle arePrice $18.00Original Price $23.50Save $5.50
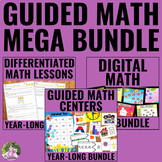 Engage your 2nd and 3rd-grade students in authentic, meaningful learning activities while you work with student groups! These best-selling math centers, differentiated lessons, math group rotation boards, and digital resources are a must-have for your classroom all year long! ⭐ This full-year guidePrice $280.00Original Price $378.75Save $98.75
Description
Looking for engaging data and graphing lessons to meet the needs of all your students? These differentiated lessons are perfect for small-group instruction while the rest of your students are engaged with Guided Math Centers.
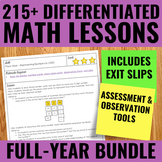
⭐ These data and graphing lessons are part of a year-long bundle of over 215 differentiated lessons!
This set of data and graphing lessons is perfect for:
✔ 2nd and 3rd-grade classrooms
✔ Teachers who believe in hands-on learning
✔ Teachers who believe in differentiation and small-group instruction
✔ Teachers who want to limit photocopying in their day
✔ Teachers who don't want to prep math activities daily
Included in this set of data and graphing lessons are:
• 18 differentiated lessons
• assessment and observation pages
• student exit slips
• activity masters
• printable manipulatives
• bonus activity
• an editable exit slip template
⭐ These graphing and data lessons are aligned with the 2020 Ontario Mathematics Curriculum expectations and CCSS standards.
❤️ Get a look at an overview of a lesson package by watching THIS VIDEO!
Be sure to take a look at the preview!
✅ Grab an entire year's worth of Differentiated Guided Math Lessons in the year-long BUNDLE!
✅ There is also a full year's worth of Guided Math Centers to engage your students while you teach these lessons available here!
Don't miss these reviews on the lesson bundle:
⭐⭐⭐⭐⭐ Deborah M. says, "I really needed this to help me get my guided math up and running in the classroom! I was struggling to differentiate the lessons to meet the needs in the classroom. Your differentiated lessons are just what I needed to get me going when I have the students for teacher time!"
⭐⭐⭐⭐⭐ Jena S. says, "One of my favourite resources on tpt! This has saved me sooo much time and is so useful for my grade 2/3 class. It allows me to meet my students where they are without having them feel left out. If you're debating it, go for it!"
⭐⭐⭐⭐⭐ Mayura N. says, "Wow! This is worth the money. My students love when I say it's guided math time. They love that it's hands-on and enjoy teacher's time since it's all fun, games and learning. Thank You!"
⭐ Don't Miss Out!
Follow me to be the first to know about my new products and freebies!
Leave feedback on this item to earn credit toward future TpT purchases!
I value your feedback greatly! It gives me the information I need to continue creating high-quality products for your classroom!
⭐ Feel free to e-mail me with any questions about this product at: questions@mrsbeattiesclassroom.com.
Connect with me for classroom ideas & resources, freebies, and more product details at any or all of the links below!
Join My Email List for FREEBIES and great teaching ideas!
This product by Erin Beattie - Mrs. Beattie's Classroom is copyrighted for single-classroom use only. This product may not be resold and can be copied for personal use within a classroom only. If you have questions, please email questions@mrsbeattiesclassroom.com
Copyright © Erin Beattie - Mrs. Beattie's Classroom
