Data Displays Combo: Box-and-whisker plots, histograms, stem-and-leaf plots
Algebra Simplified
850 Followers
Grade Levels
6th - 9th
Subjects
Resource Type
Formats Included
- PDF
Pages
9 pages
Algebra Simplified
850 Followers
Description
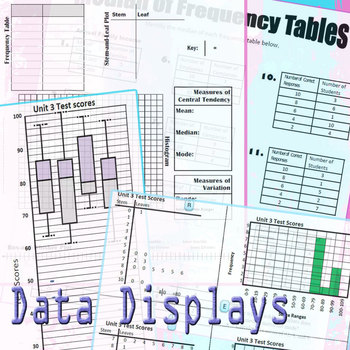
Histograms, stem-and-leaf plots (stem and leaf plots), frequency tables, box-and-whisker plots (box plots / box and whisker plots) -- Represent the same set of data with all displays. Measures of Central Tendency (Mean, Median, Mode) and Measures of Variability (Range and Interquartile Range) are also included.
This combo includes a data display template, a matching activity, and a worksheet.
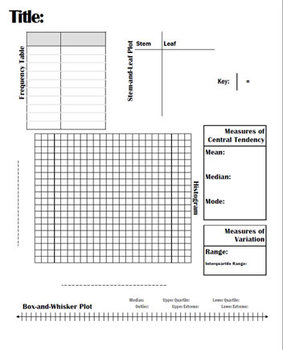
►The Multiple Data Displays Template is useful for creating a frequency table, stem-and-leaf plot, histogram, box-and-whisker plot all for the same set of data. There is also room for the measures of central tendency and the measures of variability on this one-page template. The template is NOT instructional; it is a convenient page of the bones of the displays to help students create displays quicker and more accurately. Please see the thumbnail for an image. The template can be used repeatedly for different data sets. The data is not provided for the template.
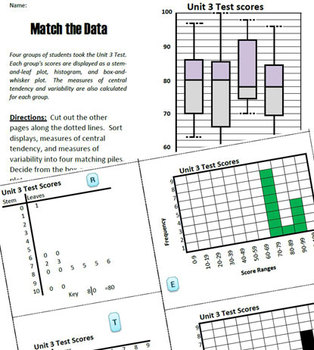
►The Data Display Sort Activity gives students 4 stem-and-leaf plots, 4 histograms, 4 box-and-whisker plots, and 4 sets of measures of central tendency & variability that correspond with 4 groups of test scores. Students are to correctly sort the given displays/measures into four groups.
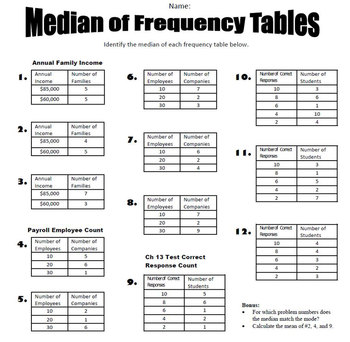
►The Medians of Frequency Tables Worksheet is a 12-question practice sheet. Students identify the medians of frequency tables.
A teacher guide is included (shown in preview). Note, the activities really shine when coupled with good teacher- prompted discussion and student-justification of choices (as mentioned in the teacher guide). Without a little teacher-magic this combo can also just be like completing a souped-up worksheet. But I sense that you have some magic in you :)
Teacher tested; student approved.
Algebra Simplified
What makes this product a must-have?
❶ Killer Value: Consider that you get 3 for the price of 1.
❷ Time Saver: The data displays in the sorting activity alone would take a ton of planning time to recreate.
❸ Novel Practice: Mixing-up that traditional worksheet perks up kids. I even had a student call it fun.
❹ Promotes Connections: Students are encourage to draw connections between the data displays and measures of central tendency.
__________________________________________________________________________
Have you ever used Hangman to spice up math practice? Check out these Hangman-style worksheets! __________________________________________________________________________
algebra, data displays, box-and-whisker plot, stem-and-leaf plot, histogram, median, frequency table, measures of central tendency, measures of dispersion, measures of variability
± All feedback is valued and encourages improved products. Did you know buyers also have access to future revisions?
Total Pages
9 pages
Answer Key
N/A
Teaching Duration
N/A
Report this resource to TPT
Reported resources will be reviewed by our team. Report this resource to let us know if this resource violates TPT’s content guidelines.


