
Creating Tables and Graphs - Help Students Analyze and Interpret Data


Sadler Science
1k Followers
Grade Levels
6th - 8th
Subjects
Resource Type
Formats Included
- Google Drive™ folder
Pages
17 pages
Sadler Science
1k Followers

Made for Google Drive™
This resource can be used by students on Google Drive or Google Classroom. To access this resource, you’ll need to allow TPT to add it to your Google Drive. See our FAQ and Privacy Policy for more information.
What educators are saying
My students found this to a engaging resource. I recommend it to anyone introducing this type of content in science or math.
This resource was very good for helping our students practice graphing and creating tables. Used these to pre-teach skills for an upcoming unit
Also included in
 This bundle is designed to help get your students to design experiments. Students will learn to:* Identify variables in an experiment* Organize their experimental data* Create their own experimentThis bundle is also aligned with the NGSS Science and Engineering Practice 3: Planning and Carrying OutPrice $18.18Original Price $25.97Save $7.79
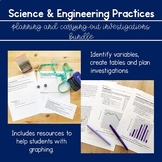 Teaching students to Plan and Carry out Investigations is difficult. But this resource will walk them through the process step-by-step. Start by having students identify variables and end with them designing their own investigations!This product contains:* PDF of introductory experimental design vPrice $21.99Original Price $29.45Save $7.46
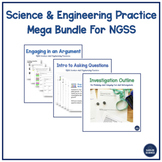 Why would you spend this much money on a resource? Because... it will give you EVERYTHING you need to in order to address the Science and Engineering Practices in your classroom. This bundle is full of scaffolds that make it easy for you to address the SEPs in your day-to-day lessons. These resoPrice $49.99Original Price $68.88Save $18.89
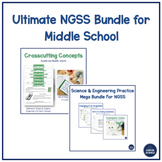 If you aren't sure how to include the Science and Engineering Practices and Crosscutting Concepts into your lessons, this is the bundle for you. Here are all of my SEP and CCC Scaffolds in one massive bundle. This bundle includes:An Introduction to Variables (IV, DV and Constant)Introduction to ArPrice $68.53Original Price $97.90Save $29.37
Description
Quickly review making tables and graphs with your students AND check your students graphing skills digitally. This resource can be used online or in person and incorporate the Science and Engineering Practice of Analyzing and Interpreting Data and the Crosscutting Concepts of Patterns.
This resource helps students with the following subcomponents of the practice of Analyzing and Interpreting Data:
- Construct, analyze, and interpret graphical displays of data sets to identify linear and nonlinear relationships.
* Students would benefit from understanding the difference between independent and dependent variables prior to using this activity.
This activity includes:
- Creating Tables and Graphs Google™ Presentation
- Google ™ Forms Check for Understanding
- Digital Graphing and Analyzing Data Activity on Google™ Presentations
- Teacher Guide and Answers Sheet
This will help students build their understanding of Science and Engineering Practice #3 Planning and Carrying Out Investigations and # 4 Analyzing and Interpreting Data.
Total Pages
17 pages
Answer Key
Included
Teaching Duration
2 days
Report this resource to TPT
Reported resources will be reviewed by our team. Report this resource to let us know if this resource violates TPT’s content guidelines.
Reviews
Questions & Answers
1k Followers
