Class Survey Data Project (Two Versions for Differentiation)
Jessica Cole - Resources to Educate
868 Followers
What educators are saying
Overall a great resource for our end of the year data project. Easy to use and lots of fun. Thank you for such a high quality resource.
Description
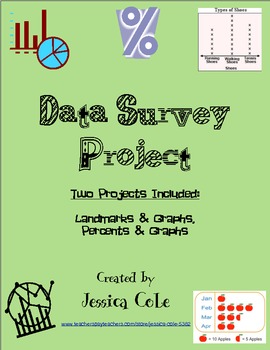
Conduct a survey! What's the question? Great math project for the last quarter.
Students use graphing skills, fractions, landmarks data, and decimals to complete a math project based on each student's individual survey question.
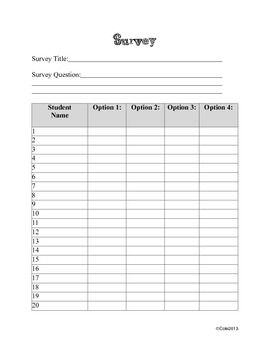
Two versions included. Each version requires students to come up with a survey question that gives four options for students to answer. Example Question: What is your favorite ice cream? Options: cookies and cream, vanilla, butter almond, or strawberry. After students decide on a survey question. they then walk around the room and poll twenty classmates, recording their answers on the pre-made survey recording sheet. Students will then analyze the data and produce different graphs to display the data. Project can be differentiated for higher learners.
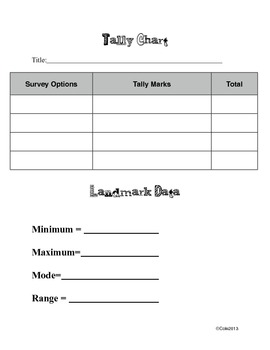
Project Version 1: Cover Sheet, Survey, Tally Chart, Landmarks(minimum, maximum, mode, range), Bar Graph, Line Graph, Pictograph, Line Plot Graph
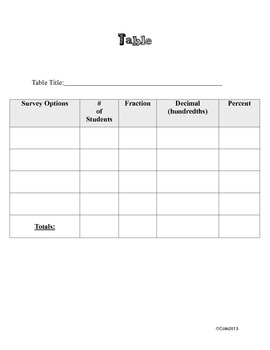
Project Version 2: Cover Sheet, Survey, Data Chart (fractions, decimals, percents), Line Graph, Bar Graph, Circle Graph
Excellent review of graphs and assessment of graphing skills.
Total Pages
15 pages
Answer Key
N/A
Teaching Duration
Lifelong tool
Report this resource to TPT
Reported resources will be reviewed by our team. Report this resource to let us know if this resource violates TPT’s content guidelines.


