Charts and Graphs - Abraham Lincoln and the Civil War
The Gifted Writer
879 Followers
Grade Levels
7th - 12th
Subjects
Resource Type
Standards
CCSSRST.6-8.7
Formats Included
- PDF
Pages
33 pages
The Gifted Writer
879 Followers
What educators are saying
I love incorporating charts and data for historical analysis but rarely have the time to create the handouts for them. I am happy with this resource and would recommend.
We take a field trip to Gettysburg each year. This was a great activity to use with my math classes. I used different graphs as warm ups for the week prior to the trip!
Description
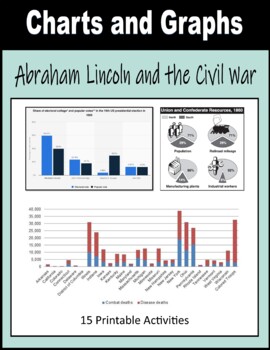
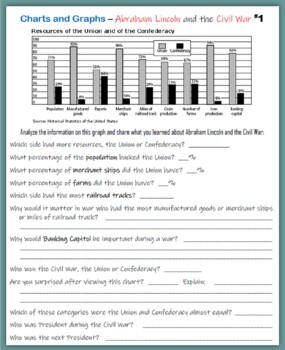
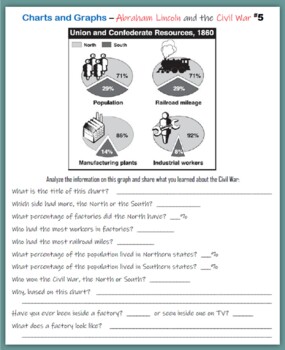
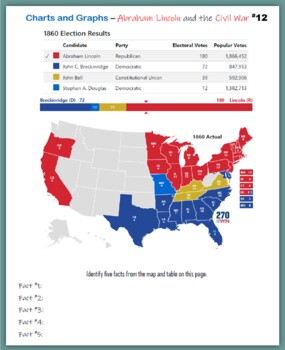
15 charts and graphs about Abraham Lincoln and the Civil War. Students analyze and describe:
- Resources of the Union and Confederacy,
- 1860 Election - popular vote and electoral college,
- Deaths in Civil War battles (Gettysburg, Shiloh, etc),
- Deaths in US wars (WWI, WWII, Korean, etc),
- Causes of discharge in Civil War,
- Retaking of the South by year (1862, 1863…),
- Most Popular Presidents,
- Age of Presidents,
- Height of Presidents,
- Cost of Presidential Campaigns,
- Vote of Succession by counties,
- and more...
Take a look at the Preview to see sample pages.
Total Pages
33 pages
Answer Key
Included
Teaching Duration
N/A
Report this resource to TPT
Reported resources will be reviewed by our team. Report this resource to let us know if this resource violates TPT’s content guidelines.
Standards
to see state-specific standards (only available in the US).
CCSSRST.6-8.7
Integrate quantitative or technical information expressed in words in a text with a version of that information expressed visually (e.g., in a flowchart, diagram, model, graph, or table).


