Calculus Curve Sketching Infographic
Denise Percival
18 Followers
Grade Levels
10th - 12th, Higher Education, Homeschool
Subjects
Resource Type
Formats Included
- PDF
Pages
2 pages
Denise Percival
18 Followers
Description
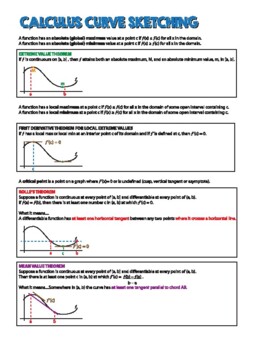
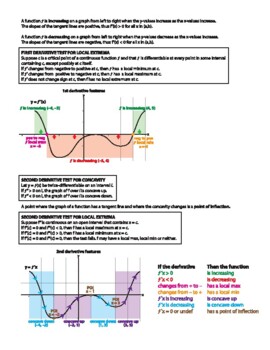
This infographic/handout clearly describes and illustrates the Extreme Value Theorem, The First Derivative Theorem for Local Extreme Values, Rolle's theorem, Mean Value Theorem, First and Second Derivative Tests and more! Help your students visualize how the second derivative graph and the graph of the function relate to each other!
Total Pages
2 pages
Answer Key
N/A
Teaching Duration
N/A
Report this resource to TPT
Reported resources will be reviewed by our team. Report this resource to let us know if this resource violates TPT’s content guidelines.


