Box and Whisker Plot Digital Drag and Drop Activity
2ndary Math
1.2k Followers
Grade Levels
6th - 7th
Subjects
Resource Type
Standards
CCSS6.SP.B.4
Formats Included
- PDF
- Google Apps™
- Easel Activity
Pages
7 Slides + Paper Answer Sheet
2ndary Math
1.2k Followers

Includes Google Apps™
The Teacher-Author indicated this resource includes assets from Google Workspace (e.g. docs, slides, etc.).
Easel Activity Included
This resource includes a ready-to-use interactive activity students can complete on any device. Easel by TPT is free to use! Learn more.
What educators are saying
Fabulous and engaging way for students to practice! The drag and drop component was way more engaging than traditional pencil and paper practice.
This was the perfect resource to help my kids learn how to construct and interpret Box & Whisker plots. They really enjoyed it and so did I. Thanks!
Also included in
- In these highly engaging activities, students will practice important 6th Grade Math skills such as one-step equations, statistics and probability, fraction operations, etc.This Bundle Contains:Placemat Activities (Digital + Printable)Picture Reveals (A Fun Twist on Pixel Puzzles)Scavenger Hunts (DiPrice $29.75Original Price $42.50Save $12.75
Description
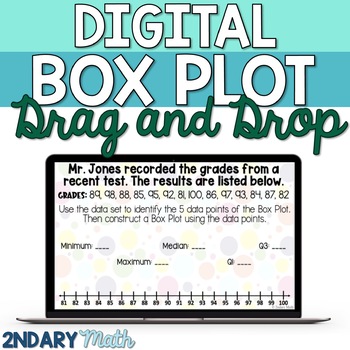
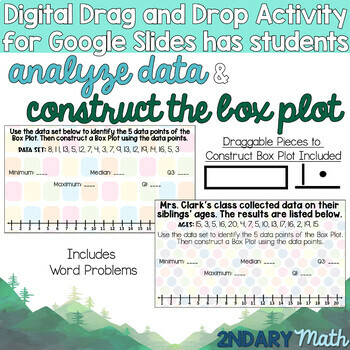
In this no-prep activity, students work on analyzing data sets to calculate the five main data points: maximum, minimum, median, first quartile, and third quartile.
This resource includes:
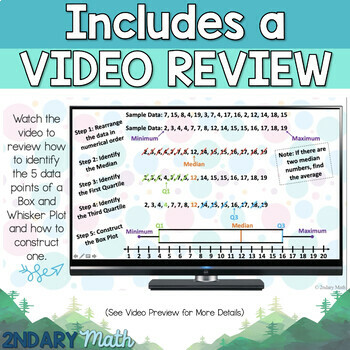
- Video reviewing a step-by-step guide on analyzing the data set, identifying the five data points, and how to construct a box and whisker plot (see Video preview above)
- Digital drag and drop activity compatible with Google Slides
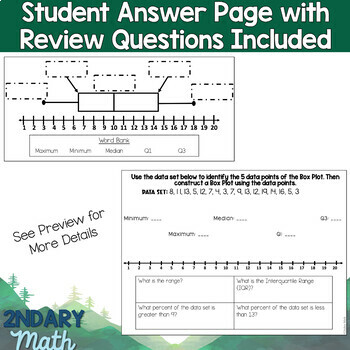
- Printable student answer sheet with review questions regarding data set (See Preview above)
- Three-Page Answer Key
This resource is great for distance learning or as a technology station within a math rotation for reviewing absolute value functions and evaluating functions. You can also use this to change things up and assign it as a digital homework assignment.
Total Pages
7 Slides + Paper Answer Sheet
Answer Key
Included
Teaching Duration
40 minutes
Report this resource to TPT
Reported resources will be reviewed by our team. Report this resource to let us know if this resource violates TPT’s content guidelines.
Standards
to see state-specific standards (only available in the US).
CCSS6.SP.B.4
Display numerical data in plots on a number line, including dot plots, histograms, and box plots.


