Blank Graphs (Tally Charts, Picture Graphs, Bar Graphs, Line Plots)
Rainbows and Whimsy with Ms Wagner
57 Followers
Grade Levels
PreK - 12th
Subjects
Resource Type
Standards
CCSS3.MD.B.3
CCSS3.MD.B.4
CCSSMP4
CCSSMP5
Formats Included
- PDF
Rainbows and Whimsy with Ms Wagner
57 Followers
What educators are saying
I used these multiple times to review and reinforce learning about data. Great resource to be able to print off exactly what I needed for a lesson on the fly, too.
I used this to supplement an activity from our math curriculum. Great resource that I will continue to use!
Description
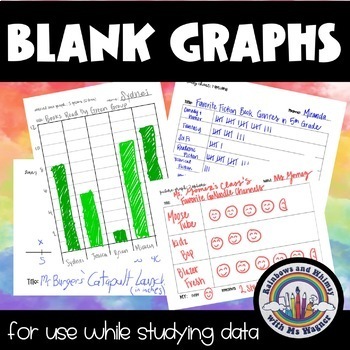
These are BLANK graphs to be used with data sets you're using in your math classroom. I designed these to align with my 3rd grade math curriculum (GoMath!), so I've included the following templates:
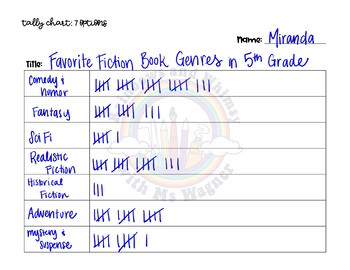
- Tally Charts
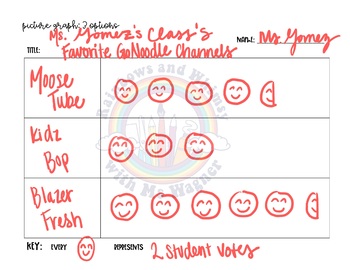
- Picture Graphs
- Line Plots
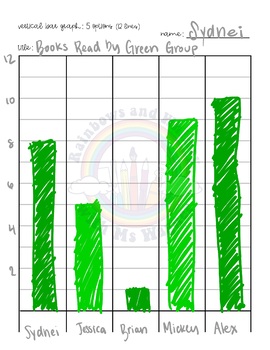
- Vertical Bar Graphs
- Horizontal Bar Graphs
All graphs come in a variety of options - different pages for graphs and charts with 3-12 options.
OVER 100 PAGES OF BLANK GRAPHS FOR USE WITH YOUR STUDENTS AND DATA!
Total Pages
Answer Key
N/A
Teaching Duration
N/A
Report this resource to TPT
Reported resources will be reviewed by our team. Report this resource to let us know if this resource violates TPT’s content guidelines.
Standards
to see state-specific standards (only available in the US).
CCSS3.MD.B.3
Draw a scaled picture graph and a scaled bar graph to represent a data set with several categories. Solve one- and two-step “how many more” and “how many less” problems using information presented in scaled bar graphs. For example, draw a bar graph in which each square in the bar graph might represent 5 pets.
CCSS3.MD.B.4
Generate measurement data by measuring lengths using rulers marked with halves and fourths of an inch. Show the data by making a line plot, where the horizontal scale is marked off in appropriate units-whole numbers, halves, or quarters.
CCSSMP4
Model with mathematics. Mathematically proficient students can apply the mathematics they know to solve problems arising in everyday life, society, and the workplace. In early grades, this might be as simple as writing an addition equation to describe a situation. In middle grades, a student might apply proportional reasoning to plan a school event or analyze a problem in the community. By high school, a student might use geometry to solve a design problem or use a function to describe how one quantity of interest depends on another. Mathematically proficient students who can apply what they know are comfortable making assumptions and approximations to simplify a complicated situation, realizing that these may need revision later. They are able to identify important quantities in a practical situation and map their relationships using such tools as diagrams, two-way tables, graphs, flowcharts and formulas. They can analyze those relationships mathematically to draw conclusions. They routinely interpret their mathematical results in the context of the situation and reflect on whether the results make sense, possibly improving the model if it has not served its purpose.
CCSSMP5
Use appropriate tools strategically. Mathematically proficient students consider the available tools when solving a mathematical problem. These tools might include pencil and paper, concrete models, a ruler, a protractor, a calculator, a spreadsheet, a computer algebra system, a statistical package, or dynamic geometry software. Proficient students are sufficiently familiar with tools appropriate for their grade or course to make sound decisions about when each of these tools might be helpful, recognizing both the insight to be gained and their limitations. For example, mathematically proficient high school students analyze graphs of functions and solutions generated using a graphing calculator. They detect possible errors by strategically using estimation and other mathematical knowledge. When making mathematical models, they know that technology can enable them to visualize the results of varying assumptions, explore consequences, and compare predictions with data. Mathematically proficient students at various grade levels are able to identify relevant external mathematical resources, such as digital content located on a website, and use them to pose or solve problems. They are able to use technological tools to explore and deepen their understanding of concepts.


