TPT
Total:
$0.00

Bar Graphs | Pictographs | Tally Charts | 1st and 2nd Grade Freebie

Rated 4.73 out of 5, based on 448 reviews
4.7 (448 ratings)
190,687 Downloads
;
Teaching Times 2
16.3k Followers
Grade Levels
1st - 2nd, Homeschool
Standards
Formats Included
  • PDF
Pages
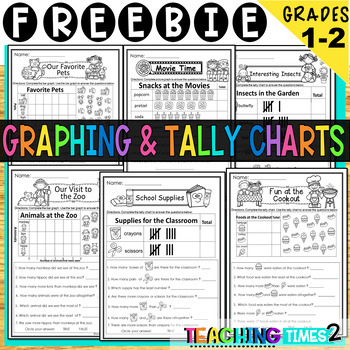
7 pages with Bar Graphing, Pictographs, and Tally Graphing
Teaching Times 2
16.3k Followers

Description

Graphing for 1st and 2nd Grade-

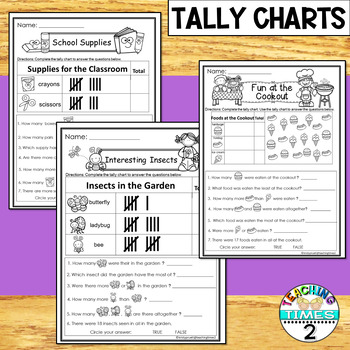
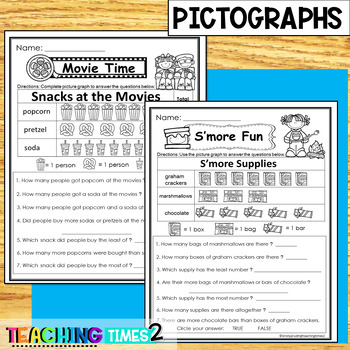
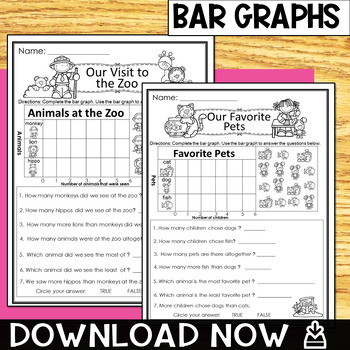
Are you looking for fun practice for your kiddos while learning about graphs? These free printables will complement any lesson. Included are 7 graphs in this bundle- Tally charts, bar graphs, and pictographs!

THESE PAGES COME FROM OUR BEST-SELLING RESOURCES:

▶️ 1st Grade Math Assessments - All-Year Bundle

▶️ 2nd Grade Math Assessments - All-Year Bundle

▼▼▼▼▼▼▼▼▼▼▼▼▼▼▼▼▼▼▼▼▼▼▼▼▼▼▼▼▼▼▼▼▼▼▼▼▼▼▼▼▼▼

If you would like to get updates on NEW and CURRENT resources....

▶️ SIGN UP for our VIT CLUB (Very Important Teachers) to receive freebies!

▶️ FOLLOW US on TEACHERS PAY TEACHERS!

▶️ FOLLOW the TEACHING TIMES 2 BLOG!

▶️ FOLLOW US on PINTEREST!

▶️ FOLLOW US on FACEBOOK!

▶️ FOLLOW US on INSTAGRAM!

Thanks and remember to keep learning FUN!! --Kristy & Misty ❤

▼▼▼▼▼▼▼▼▼▼▼▼▼▼▼▼▼▼▼▼▼▼▼▼▼▼▼▼▼▼▼▼▼▼▼▼▼▼▼▼▼▼

Copyright © Teaching Times 2

All rights reserved by the author.

Permission to copy for single classroom use only.

Electronic distribution is limited to single classroom use only.

If you have any questions about this resource, please contact us at

customerservice@teachingtimes2.com

Total Pages
7 pages with Bar Graphing, Pictographs, and Tally Graphing
Answer Key
N/A
Teaching Duration
N/A
Report this resource to TPT
Reported resources will be reviewed by our team. Report this resource to let us know if this resource violates TPT’s content guidelines.

Standards

to see state-specific standards (only available in the US).
Organize, represent, and interpret data with up to three categories; ask and answer questions about the total number of data points, how many in each category, and how many more or less are in one category than in another.
Draw a picture graph and a bar graph (with single-unit scale) to represent a data set with up to four categories. Solve simple put-together, take-apart, and compare problems using information presented in a bar graph.

Reviews

Questions & Answers

16.3k Followers