Arcade Games -- Relations, Patterns & Functions - 21st Century Math Project
- Zip
- Google Apps™

Also included in
- This is a selection of my Relations & Functions resources all in a money saving Essential Bundle! You save significant money and time versus purchasing these separately!Essential Bundles are designed to give you everything you need to rock your unit. Warmups, Notes, Activities, Games, Exit TickePrice $35.00Original Price $97.00Save $62.00
- The project is the core of what I have built my classroom around. Scaffolding learners to real world projects. This bundle includes the 105+ math projects I have written. This is over 2,700 pages of content.21st Century Math Projects each scaffold through an authentic context and math skill buildingPrice $395.00Original Price $564.00Save $169.00
- 12 of my best selling projects/units all in an organized money saving bundle! These engaging, student/teacher approved math projects that provide rigor, relevance, and cross-curricular content altogether. I have each of these projects advertised separately these projects are $63, so this is almost 3Price $45.00Original Price $63.00Save $18.00
Description
In the hustle and bustle of an arcade, gamers are quick to snatch their reward tickets and move to their next station. How are the amounts of tickets determined? Go to the arcade to practice relations, patterns and functions!
In this 21st Century Math Project, you will be given a mapping to the Content Standards, an outline for how to implement the project, 3 different assignments for students to use, and an answer key. ***THIS PRODUCT HAS BEEN UPDATED WITH A GOOGLE SLIDES INTERACTIVE VERSION INCLUDED. REDOWNLOAD IF YOU HAVE IT ALREADY***
Download the preview to see pretty much everything!
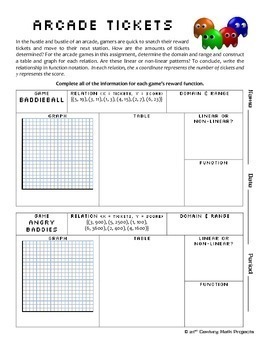
-- In “Arcade Tickets” students will analyze the number of tickets that they receive for certain levels in a game and interpret them as relations with a domain and range. They will have to interpret these functions and determine if they are linear or non-linear and write the relationship in function notation.
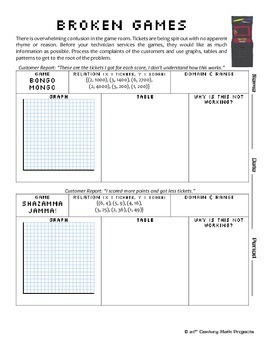
-- In “Broken Games” students will deal with a variety of malfunctions of games. They must sketch and analyze graphs, discover games that are not functions and process customer complaints. In a couple problems, customers will provide a narrative that students must interpret into mathematics and uncover the problem.
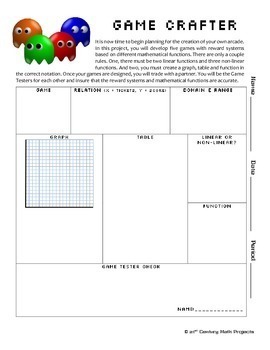
-- In “Game Crafter”, students will design five games based on different mathematical functions. They must include linear and non-linear ticket methods and write their functions in correct notation. They will share their work with a partner who will be the “Game Tester” who will see if the functions are correct.
You may be interested in the following discounted bundles. SAVE $$$!
•21st Century Math Projects -- All the Projects
Need an Entire Curriculum?
•21st Century Algebra –- the Entire Curriculum
For more tips, tricks and ideas check out the Clark Creative Education Blog
And join our community where I post ideas, anecdotes, elaborations & every once in a while I pass out TPT gift cards! And jokes! I do jokes too!

