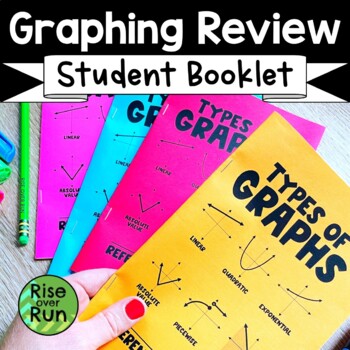
Algebra 1 Review Booklet for Graphing Different Types of Functions
- PDF
What educators are saying
Also included in
- Do you love discovery learning, collaboration, hands-on activities, and projects that help students make sense of the math they are learning? This curriculum is packed with engaging and challenging Algebra I and 8th grade math resources for the whole year. A variety of activities, inquiry learningPrice $350.00Original Price $677.94Save $327.94
- This curriculum bundle includes a variety of activities, assessments, games, group activities, projects, inquiry lessons, guided notes, and more for teaching Algebra I CCSS standards. The activities are centered on discovery learning and engaging activities with real world connections. Lessons helpPrice $225.00Original Price $445.21Save $220.21
- Wrap up your year of Algebra I with these 10 engaging activities. Students losing focus as the year ends? These resources are fun yet challenging! They are the perfect way to get students thinking and reviewing what they have learned. Plus, save yourself a week or two of planning! These activitiePrice $19.00Original Price $31.49Save $12.49
Description
Help your students prepare for end of year testing! They can review all the type of graphs they have learned: linear, quadratic, exponential, absolute value, piecewise, inequalities, and systems of equations. This booklet brings together all the graphing concepts students have learned.
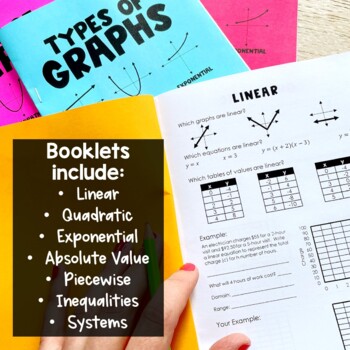
This booklet includes:
- Linear
- Quadratic
- Exponential
- Absolute Value
- Piecewise
- Inequalities
- Systems
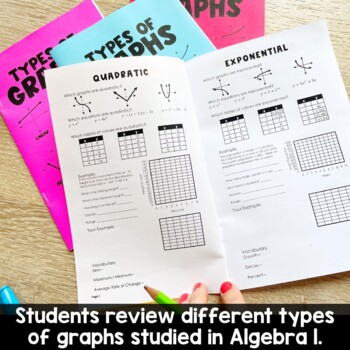
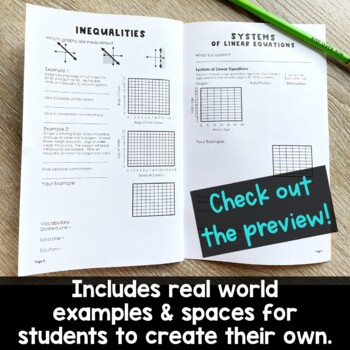
Students identify what the different types of relations look like on a graph, as an equation, and in a table of values. They answer questions and draw graphs for real world examples of each type. They also create their own examples, pushing them to think and get creative!
This a great resource to use at the end of the year to prepare for state EOC tests. Students review what makes each type of function different, they practice word problems, and they see important vocabulary terms.
The booklet could also be used at the beginning of Algebra 2 to see what students remember.
Answer keys are included.
Check out the preview to see more details!


