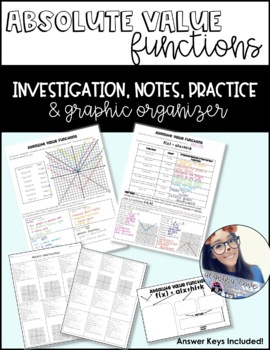
Absolute Value Functions Investigation, Notes, Practice and Graphic Organizer
AlgebraLove
382 Followers
Resource Type
Standards
CCSS8.F.A.1
CCSS8.F.A.2
CCSSHSA-CED.A.2
CCSSHSF-IF.A.1
CCSSHSF-IF.A.2
Formats Included
- PDF
Pages
15 pages
AlgebraLove
382 Followers
What educators are saying
LOVE! This was an excellent resource for my students when reviewing topics from Algebra 1. I love the format of the resource and the pace was perfect for my students.
great resource that my kids loved to use! They loved the format of the activity and I loved how it addressed the important standards.
Description
Updated as of 1/2/24
See the preview for all product pages!
In this product you will have:
1. Absolute Value Functions Investigation - Students graph different abs. value functions in different colors to see the transformations. They compare these transformations with the parent functions.
2. Notes - After the investigation, students summarize what they learned by using the form f(x)=a|x+h|+k and comparing the transformation with the parent function. Lastly, there are two examples that can be completed with the teacher's guidance.
3. Practice - 15 practice problems graphing absolute value functions and labeling the vertex, min/max, transformation, domain, and range.
4. Graphic Organizer - filled in or blank. see preview
Total Pages
15 pages
Answer Key
Included
Teaching Duration
N/A
Report this resource to TPT
Reported resources will be reviewed by our team. Report this resource to let us know if this resource violates TPT’s content guidelines.
Standards
to see state-specific standards (only available in the US).
CCSS8.F.A.1
Understand that a function is a rule that assigns to each input exactly one output. The graph of a function is the set of ordered pairs consisting of an input and the corresponding output.
CCSS8.F.A.2
Compare properties of two functions each represented in a different way (algebraically, graphically, numerically in tables, or by verbal descriptions). For example, given a linear function represented by a table of values and a linear function represented by an algebraic expression, determine which function has the greater rate of change.
CCSSHSA-CED.A.2
Create equations in two or more variables to represent relationships between quantities; graph equations on coordinate axes with labels and scales.
CCSSHSF-IF.A.1
Understand that a function from one set (called the domain) to another set (called the range) assigns to each element of the domain exactly one element of the range. If 𝘧 is a function and 𝘹 is an element of its domain, then 𝘧(𝘹) denotes the output of 𝘧 corresponding to the input 𝘹. The graph of 𝘧 is the graph of the equation 𝘺 = 𝘧(𝘹).
CCSSHSF-IF.A.2
Use function notation, evaluate functions for inputs in their domains, and interpret statements that use function notation in terms of a context.


