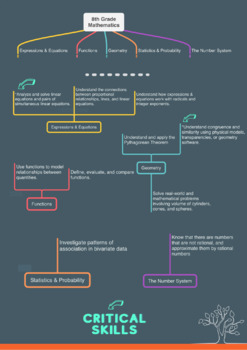
8th Grade Math Skills - Overview (CCRS)
Quick References
5 Followers
Resource Type
Standards
CCSS8.EE.A.1
CCSS8.EE.A.2
CCSS8.EE.A.3
CCSS8.EE.A.4
CCSS8.EE.B.5
Formats Included
- Portable Network Graphics
Pages
1 page
Quick References
5 Followers
Description
In order to get where we are going we need to know where we are headed!
There is SO MUCH to cover in 8th grade mathematics. Consider using this in your syllabus or to give to parents to help them understand all the work you’ll be doing!
Total Pages
1 page
Answer Key
N/A
Teaching Duration
N/A
Report this resource to TPT
Reported resources will be reviewed by our team. Report this resource to let us know if this resource violates TPT’s content guidelines.
Standards
to see state-specific standards (only available in the US).
CCSS8.EE.A.1
Know and apply the properties of integer exponents to generate equivalent numerical expressions. For example, 3² × (3⁻⁵) = (3⁻³) = 1/3³ = 1/27.
CCSS8.EE.A.2
Use square root and cube root symbols to represent solutions to equations of the form 𝘹² = 𝘱 and 𝘹³ = 𝘱, where 𝘱 is a positive rational number. Evaluate square roots of small perfect squares and cube roots of small perfect cubes. Know that √2 is irrational.
CCSS8.EE.A.3
Use numbers expressed in the form of a single digit times an integer power of 10 to estimate very large or very small quantities, and to express how many times as much one is than the other. For example, estimate the population of the United States as 3 × 10⁸ and the population of the world as 7 × 10⁹, and determine that the world population is more than 20 times larger.
CCSS8.EE.A.4
Perform operations with numbers expressed in scientific notation, including problems where both decimal and scientific notation are used. Use scientific notation and choose units of appropriate size for measurements of very large or very small quantities (e.g., use millimeters per year for seafloor spreading). Interpret scientific notation that has been generated by technology.
CCSS8.EE.B.5
Graph proportional relationships, interpreting the unit rate as the slope of the graph. Compare two different proportional relationships represented in different ways. For example, compare a distance-time graph to a distance-time equation to determine which of two moving objects has greater speed.


