
8th GRD enVision Lesson Plans MATH Topic 3 Use Functions to Model BUNDLE


- Zip
Products in this Bundle (6)
showing 1-5 of 6 products
Also included in
 This BUNDLE includes 52 LESSON PLANS!This is for the ENTIRE 8th GRADE enVision CURRICULUM!All lesson plans are EXTREMELY DETAILED and directly connect to the enVision Math Curriculum for 8th grade. These are JUST THE LESSON PLAN DOCUMENTS, NOT the actual activities or assessment tools. The lessoPrice $467.53Original Price $519.48Save $51.95
Description
This BUNDLE includes SIX LESSON PLANS. All lesson plans are EXTREMELY DETAILED and directly connects to the enVision Math Curriculum for 8th grade.
These are JUST THE LESSON PLAN DOCUMENTS, NOT the actual activities or assessment tools.
The lessons included in this bundle are for Topic 3 - Use Functions to Model Relationships. The lesson titles are as follows:
Lesson 3-1: Understand Relations and Functions
Lesson 3-2: Connect Representations of Functions
Lesson 3-3: Compare Linear and Nonlinear Functions
Lesson 3-4: Construct Functions to Model Linear Relationships
Lesson 3-5: Intervals of Increase and Decrease
Lesson 3-6: Sketch Functions from Verbal Descriptions
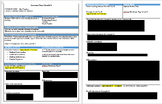
Each lesson plan is 4 pages long and includes the following categories:
- enVision Topic
- Next Generation / Common Core Standards
- Instructional Goals
- Essential Question
- Vocabulary
- Supplementary Materials
- Develop Problem Based Learning - Solve & Discuss It
- Practice and Application Activities
- Scaffolds / Differentiation / Questioning
- Developing Visual Learning with Examples and Videos
- Practice and Application
-Item Skills Analysis
- Special Education Component
- English Language Learner Component
- SEL Component
- Review, Assessment, and Extension
- Teacher Lesson Reflection Questions
These are JUST THE LESSON PLAN DOCUMENTS, NOT the actual activities or assessment tools.
**PLEASE REMEMBER TO LEAVE A REVIEW :)
***TPT will give you "credits" for every review that you leave!!
****Thank you so much in advance!!
