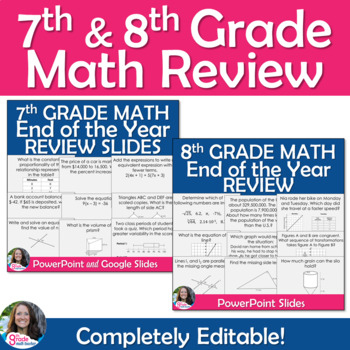
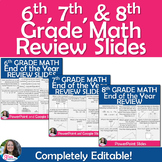
7th and 8th Grade Math End of the Year Review PowerPoint Slides
- Zip

Products in this Bundle (2)
Also included in
- Are you ready for state testing? Here's how to be sure! Review all the 6th, 7th, and 8th grade math standards with your students using these 3 editable PowerPoint presentations! Each set of slides has at least 50 questions (one per slide) that are completely aligned with the Common Core standards.UsPrice $10.00Original Price $12.75Save $2.75
Description
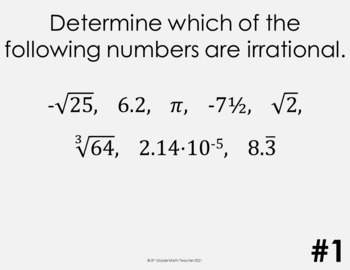
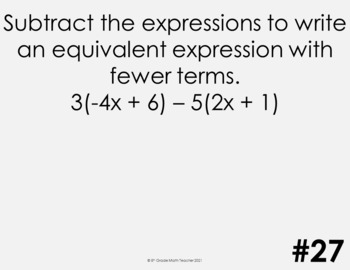
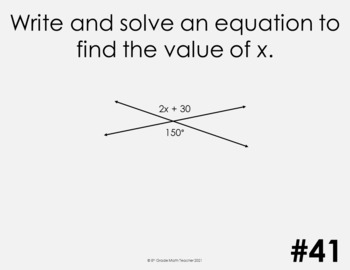
Are you ready for state testing? Here's how to be sure! Review all the 7th and 8th grade math standards with your students using these two editable PowerPoint presentations! Each set of slides has 50 questions (one per slide) that are completely aligned with the Common Core standards.
Use these slides to review all the content from throughout the year with your students. Whether you are reviewing for the state test or an end of the year final, these slides are all you need! You can use this resource in so many different ways!
- Play a review game
- Choose 2-3 questions as a warm-up each day
- Print the questions and hang them around the room for students to complete
- Print the questions to use in stations
- Print slides as “handouts” to use as task cards
With both PowerPoint presentations, there are questions from each of these domains in this order:
- The Number System
- Expressions & Equations
- Functions
- Geometry
- Statistics & Probability
An answer key is included with both to make them easy to use!
Because you can edit the slides, you can add in your own directions, duplicate slides and change the numbers to create more questions, combine slides from both the 7th grade and the 8th grade, add in topics that are specific to your state, and whatever else helps you review with your students.
What's included:
This is a great bank of questions to help make sure all the math content standards have been taught and practiced again before the end of the year.
Click here to follow me!
You may also like...
Summer Function Patterns Activity
8th Grade Math Posters for Word Wall
7th Grade Math Posters for Word Wall
7th & 8th Grade Math Posters Bundle
Each license you purchase is for you to use in your classroom only. You may not share this resource. If you would like others in your school to use this resource, please purchase additional licenses.

