(7th) Quiz Show Game Ratios and Proportions in a PowerPoint Presentation
- Zip
Description
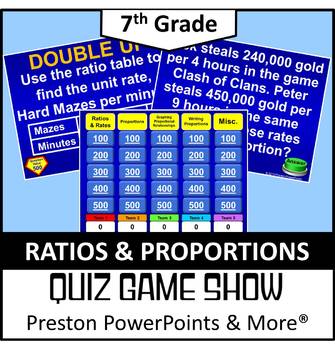
7th Grade Math Quiz Show Game Ratios and Proportions in a PowerPoint Presentation
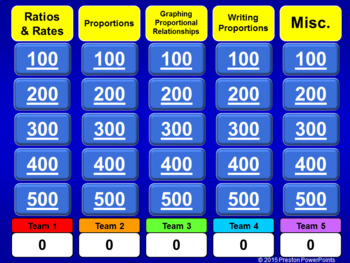
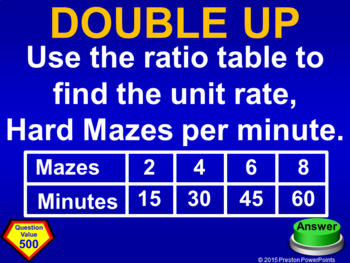
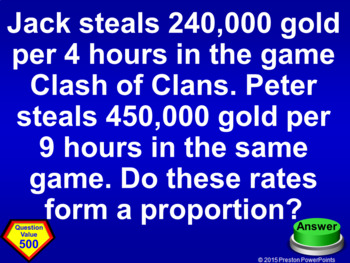
This Quiz Show game, Jeopardy Style, is a great way to review a chapter. There are 25 questions and a scoreboard so you don’t have to write the score on a side board. Each page has the point value!
This Quiz Show game covers all of the following:
Ratios and Rates 7.RP.1, 7.RP.3
Proportions 7.RP.2a, 7.RP.2b, 7.RP.2d
Writing Proportions 7.RP.2c, 7.RP.3
NEW: The lesson is in an editable format so you can tailor the lesson to your class. The problems and clipart can’t be edited due to the TOU and to maintain the copyright integrity of the product. If you need an alternative version because your country uses different measurements, units, or slight wording adjustment for language differences just email me at PrestonPowerPoints@gmail.com. I am respond to email quickly.
This Review lesson applies to the Common Core Standard:
Ratios & Proportional Relationships 7.RP.1, 7.RP.2, 7.RP.2a, 7.RP.2b, 7.RP.2c, 7.RP.2d, 7.RP.3
Analyze proportional relationships and use them to solve real-world and mathematical problems.
1. Compute unit rates associated with ratios of fractions, including ratios of lengths, areas and other quantities measured in like or different units. For example, if a person walks 1/2 mile in each 1/4 hour, compute the unit rate as the complex fraction 1/2/1/4 miles per hour, equivalently 2 miles per hour.
2. Recognize and represent proportional relationships between quantities.
a. Decide whether two quantities are in a proportional relationship, e.g., by testing for equivalent ratios in a table or graphing on a coordinate plane and observing whether the graph is a straight line through the origin.
b. Identify the constant of proportionality (unit rate) in tables, graphs, equations, diagrams, and verbal descriptions of proportional relationships.
c. Represent proportional relationships by equations. For example, if total cost t is proportional to the number n of items purchased at a constant price p, the relationship between the total cost and the number of items can be expressed as t = pn.
d.Explain what a point (x, y) on the graph of a proportional relationship means in terms of the situation, with special attention to the points (0, 0) and (1, r) where r is the unit rate.
3. Use proportional relationships to solve multistep ratio and percent problems. Examples: simple interest, tax, markups and markdowns, gratuities and commissions, fees, percent increase and decrease, percent error.
The presentation has 53 slides. Use as many or as few of the problems to help your students learn each concept. For more PowerPoint lessons & materials visit Preston PowerPoints.
Are you looking for the 7th Grade Ratios and Proportions Bundle? Click here!
Are you looking for just the 7th Grade Quiz Show Game, Jeopardy, Bundle? Click here!
Are you looking for a Jeopardy that you can put your own problems in? Try this Blank Jeopardy Template. Click here!
This resource is for one teacher only. You may not upload this resource to the internet in any form. Additional teachers must purchase their own license. If you are a coach, principal or district interested in purchasing several licenses, please contact me for a district-wide quote at prestonpowerpoints@gmail.com. This product may not be uploaded to the internet in any form, including classroom/personal websites or network drives.


