6th Grade Statistics
One for the Books
1.3k Followers
Grade Levels
5th - 7th
Subjects
Resource Type
Standards
CCSS6.SP.A.2
CCSS6.SP.A.3
CCSS6.SP.B.4
CCSS6.SP.B.5
CCSS6.SP.B.5a
Formats Included
- Zip
Pages
15+
One for the Books
1.3k Followers
What educators are saying
We used this to break up the monotony of learning DATA. THe students loved it and were able to analyze data well afterward.
Products in this Bundle (5)
Also included in
- Data and Statistics - Data and Graphs - Mean, Median, ModeGeneral Information: This engaging statistics unit is set up to get students active while collecting and learning about data. By having a friendly competition, while promoting healthy living, students get excited about the data collection. InPrice $15.50Original Price $20.25Save $4.75
- Statistics for 6th Grade BundleThis sixth grade statistics bundle includes lessons and/or practice activities with mean, median, mode, range, outliers, mean absolute deviation, frequency tables and histograms, box and whisker plots, line plots and statistical questions.For more information, please sPrice $24.99Original Price $33.24Save $8.25
- 6th grade math can be tricky. Students are old enough that they want to be independent, but still young enough that they desire engaging 6th grade math activities, fun projects, and silly lessons, and games. This bundle is not an entire year of content. This bundle does not cover all math standarPrice $187.00Original Price $293.51Save $106.51
Description
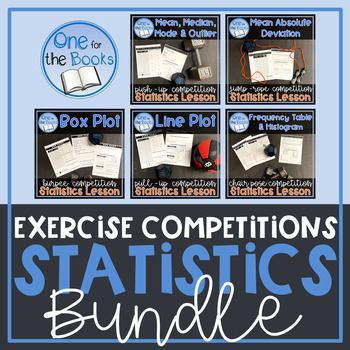
Included in this 6th Grade Statistics bundle, is a series of engaging lessons designed to get students up and moving to collect actual data. The students then analyze two sets of data collected in the fitness competitions to get a better understanding of various 6th grade statistics topics such as measures of center, measures of variability, line plots, histograms and box plots.
To see a sample lesson plan and student notes page, check out the FREEBIE below!
Mean, Median, Mode and Outlier Lesson
For more information, please view each individual resource.
Total Pages
15+
Answer Key
Included
Teaching Duration
1 Week
Report this resource to TPT
Reported resources will be reviewed by our team. Report this resource to let us know if this resource violates TPT’s content guidelines.
Standards
to see state-specific standards (only available in the US).
CCSS6.SP.A.2
Understand that a set of data collected to answer a statistical question has a distribution which can be described by its center, spread, and overall shape.
CCSS6.SP.A.3
Recognize that a measure of center for a numerical data set summarizes all of its values with a single number, while a measure of variation describes how its values vary with a single number.
CCSS6.SP.B.4
Display numerical data in plots on a number line, including dot plots, histograms, and box plots.
CCSS6.SP.B.5
Summarize numerical data sets in relation to their context, such as by:
CCSS6.SP.B.5a
Reporting the number of observations.


