
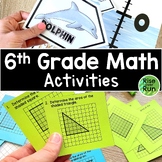
6th Grade Real World Graphs with Independent & Dependent Variables


- PDF
What educators are saying
Also included in
 Looking for sixth grade math resources that are engaging, meaningful, standards-based, and help build conceptual understanding? In this big pack are 35+ resources that include hands-on learning, card sorts, games, projects, group activities, and more! These activities are rigorous and engaging. AsPrice $73.00Original Price $109.25Save $36.25
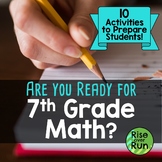 Prepare your students for seventh grade math with these 10 resources and a checklist. Perfect for 7th grade teachers to use at the beginning of the year or for 6th grade teachers to use at the end of the year. These activities are engaging and challenging, focused on the skills students need for sPrice $15.00Original Price $21.49Save $6.49
Description
These multiple representation math tasks help students make connections between graphs, tables, equations, and real world scenarios. Students are given a little information and must think how to fill in the rest!
7 activity sheets are provided, and each one includes:
- a story
- a graph
- a table
- an equation
- independent and dependent variables
- a space for students to write their own question and answer
Each sheet provides just enough information so students can figure out the rest!
A blank template is included as well so students can create their own relationship.
Multiple representations are a great way to add rigor to your lesson. Students are challenged to show their understanding in multiple ways.
These worksheets can be used as partner work or individual work. Or, place them inside dry erase sleeves and let students use dry erase markers on each one. They work great as an assessment too.
The sheets vary in difficulty, so you could use them throughout your unit or use them to differentiate.
Two printing options are included: 1 per page or 2 per page.
Answer keys are included.
_________________________________
Check out what teachers like you have said about these graphing tasks:
⭐️⭐️⭐️⭐️⭐️ Katie French says, "This was exactly what I needed! The students were challenged (in a good way!) and it definitely helped them through the concept."
⭐️⭐️⭐️⭐️⭐️ Jessica M. says, "Perfect introduction to several 6th grade concepts: independent/dependent variables, equations, and graphing equations."
⭐️⭐️⭐️⭐️⭐️ Elizabeth E. says, "Thank you for how easy this was to use! It was great for class discussion and teamwork for the kids."
_________________________________
Save when you buy my bundle of 6th grade math resources!
