TPT
Total:
$0.00

6th Grade Math Spiral Review Bingo Game | End of Year Test Prep Activity

Rated 5 out of 5, based on 1 reviews
5.0 (1 rating)
;
The Learning Effect
8.4k Followers
Grade Levels
6th - 7th
Standards
Formats Included
  • Zip
  • Google Apps™
Pages
60 PDF & PPT + Google Slides version
$4.25
$4.25
Share this resource
Report this resource to TPT
The Learning Effect
8.4k Followers
Includes Google Apps™
The Teacher-Author indicated this resource includes assets from Google Workspace (e.g. docs, slides, etc.).

What educators are saying

I used this as the end of year (last week of school) activity to keep the kids focused on math after finishing their state FAST test. They enjoyed it, and I gave prizes to the winners.

Description

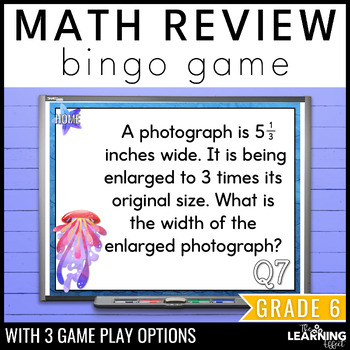
Try a new way to review 6th grade math concepts with this bingo game! This engaging test prep is low prep for teachers and fun for students.

Perfect for 6th grade end of year review or 7th grade beginning of year review. This bingo activity can be played whole-class, in math centers, or small groups.

THIS RESOURCE INCLUDES

  • 3 options for playing:
    • Bingo PowerPoint
    • Bingo Google Slides™
    • Printable questions
  • Instructions for each play option
  • 40 unique printable bingo cards
  • 2 printable blank bingo cards
  • Printable question tracker
  • Answer key

INCLUDED FILE FORMATS

  • Zipped Files: This resource includes more than one file and is zipped. You will need to unzip the file to access the resources.
  • PDF: This resource requires Adobe Reader (free software). The contents may not show correctly if using other PDF software.
  • PowerPoint: This resource requires PowerPoint software installed on a PC or Mac. It has not been tested with other presentation software. If you do not have PowerPoint, you can use the Google Slides™ version.
  • Google Slides™: To access the Google Slides™ version, you need to have a (free) Google account. The included PDF contains a link to access the digital resource.

PLEASE NOTE

⚠️ The files are NOT editable in any way, and you will not be able to manipulate the content inside.

⚠️ This resource is NOT listed with the TpT Google Drive tool. You will need to manually make a copy of the Google file with the link in the PDF you download after you purchase.


6th Grade Math Resources


CLICK HERE to follow The Learning Effect and be the first to know when NEW resources are added to my store!

New resources are always discounted for the first 48 hours.

CONNECT WITH ME

The Learning Effect Blog • Instagram • Facebook • Email Sign Up

Please ask ALL questions before purchasing. 

© The Learning Effect, LLC | Tiffany Schmidt

All rights reserved by author. 

Permission to copy for single classroom use only.

Please purchase additional licenses at a discounted rate for additional users. 

Intended for classroom and personal use only.

Total Pages
60 PDF & PPT + Google Slides version
Answer Key
Included
Teaching Duration
N/A
Last updated 3 months ago
Report this resource to TPT
Reported resources will be reviewed by our team. Report this resource to let us know if this resource violates TPT’s content guidelines.

Standards

to see state-specific standards (only available in the US).
Find the area of right triangles, other triangles, special quadrilaterals, and polygons by composing into rectangles or decomposing into triangles and other shapes; apply these techniques in the context of solving real-world and mathematical problems.
Find the volume of a right rectangular prism with fractional edge lengths by packing it with unit cubes of the appropriate unit fraction edge lengths, and show that the volume is the same as would be found by multiplying the edge lengths of the prism. Apply the formulas 𝘝 = 𝘭 𝘸 𝘩 and 𝘝 = 𝘣 𝘩 to find volumes of right rectangular prisms with fractional edge lengths in the context of solving real-world and mathematical problems.
Represent three-dimensional figures using nets made up of rectangles and triangles, and use the nets to find the surface area of these figures. Apply these techniques in the context of solving real-world and mathematical problems.
Summarize numerical data sets in relation to their context, such as by:
Giving quantitative measures of center (median and/or mean) and variability (interquartile range and/or mean absolute deviation), as well as describing any overall pattern and any striking deviations from the overall pattern with reference to the context in which the data were gathered.

Reviews

Questions & Answers

8.4k Followers