
3rd Grade Magic of Math Bar Graphs, Pictographs, Line Plots, Frequency Tables


- Zip
What educators are saying
Also included in
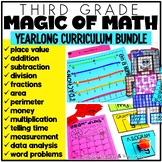 3rd Grade Teachers, are you tired of scrambling around for math lesson plans each week? Or bored with the textbook? Magic of Math may be just what you need! These DONE FOR YOU lesson plans, activities, mini-lessons, and assessments will get your 3rd grade math students right on track. The best part?Price $125.00Original Price $152.00Save $27.00
Description
It's time to up the engagement when teaching data analysis and graphing in 3rd grade! Try this complete set of plans and hands-on activities for analyzing data and collecting, graphing (bar, pictograph, line plot, and frequency tables), and a fun graphing project!
The Magic Of Math Unit 8 for THIRD GRADE focuses on:
Week 1: Bar Graphs (scales of 1 or more)
Week 2: Pictographs (scales vary)
Week 3: Line Plots with Measuring to the Nearest Quarter and Half Inch
Week 4: Frequency Tables and Graphing Project
Here is what is included in this month long unit for 3rd grade:
-Daily Lesson Plans for 20 days
-Aligned with the 3rd Grade Common Core and TEKS
-20 Word Problems for each day that complement the skills
-Interactive Notebook Printables
-Games, Activities, and Crafts to enhance learning
-Minilessons with ideas on how to teach the skills as well as materials needed
-Vocabulary Cards
-I Can Statements
-Assessments
-Anchor Chart and Pocket Chart Materials
Want a Closer Look? Here are some (not all!) activities included:
- Labeling a Bar Graph
- Bar Graph Question Stems
- Class Bar Graph Labels
- Roll and Graph
- Bar Graphs for Interactive Notebooks
- Candy Shop Bar Graph
- Finger Twister Bar Graph
- Identifying Different Scales
- Bar Graph Scoot
- Light up your graph NEON
- Bar Graph Quick Assessment
- Class Pictographs
- Pictograph Question Stems
- Labeling a Pictograph
- Graphing M&Ms
- Turning Bar Graphs into Pictographs
- Sweet! Salty! Sour!
- Superhero Spin Pictograph
- Spin and Graph Emojis
- Hungry Hungry Hippos Pictograph
- Pictograph Quick Assessment
- Line Plot Labeling
- Line Plot Question Stems
- 5 Class Line Plots (can also create dot plots)
- Target Practice and Plot
- Line Plot Interactive Notebooks
- I'll Huff and I'll Puff- Measure and Plot
- Insect Investigations- Intro to Measuring to the nearest quarter and half inch
- Measuring from A-Z- Measure and Plot
- The Great Gummy Worm Measure- Measure and Plot
- The Length of Snakes- Measure and Plot
- Line Plot Assessment
- Measure and Plot Assessment
- Reading Frequency Tables and Answering Questions
- Frequency Table Interactive Notebooks
- Graphing Project: Choosing a Topic, Creating a Survey, Gathering Data, Creating a Bar Graph, Line Plot, and Pictograph from Data, Generating Questions, and Rubric
- Roll, Tally, and Analyze
- Red Light, Green Light Frequency Table Game
- Creating Pictographs from Frequency Tables
- Group Work: Creating Pictographs from Frequency Tables
- Word Problem Scoot for Review
- 3 Assessments in Week 4: Bar Graph, Pictograph, and Frequency Table
What is the Magic of Math?
The Magic of Math is a series of math lesson plans and activities that can be used as your math curriculum or as a supplement to the program that you are already using. We provide the daily lesson plans, word problem, mini-lesson, activity, and interactive notebook entries for four weeks at a time. If you don't have time for it all, that's okay too! You can just pick and choose the pieces that you want to incorporate into your math block!
Are these activities repeats from other units you have?
Absolutely NOT! We create all new activities for each Magic of Math unit. They are all unique to this purchase and are not copy/pasted from things we have previously made.
What is the difference between Magic of Math and other units you have?
Magic of Math is organized as daily lesson plans with everything you need rather than just activities.
WHAT IT IS NOT:
It is NOT a collection of worksheets. You will not find any worksheets in this series. Instead we use games, hands-on activities, engaging mini-lessons, and interactive notebooks to build our curriculum. We do try to keep in mind the amount of prep that is involved with the lessons, but some things will need to be printed, cut, and put together to use in your classroom.
Want to know more about Magic of Math? You can find a blog post about it HERE!
Check out all 3rd Grade Math Units Below:
3rd Grade Magic of Math: THE BUNDLE HERE
Unit One: Place Value HERE
Unit Two: Addition and Subtraction HERE
Unit Three: Multiplication HERE
Unit Four: Division HERE
Unit Five: Fractions HERE
Unit Six: Geometry, Perimeter, and Area HERE
Unit Seven: Time, Capacity, and Mass/Weight HERE
Unit Eight: Data Analysis HERE
Unit Nine: Multiplication and Division HERE
Unit Ten: Money and Personal Financial Literacy HERE
