4 results
Higher education statistics tools for common cores for SMART Notebook

Our 5 Senses Body Parts Adapted Matching Activity Book
This is a nice SmartBoard activity for learning our different body parts on the SmartBoard interactively.Please click on the various sample pages to see the colorful pictures, activities and scoring rubric that are both motivating and fun for expanding prior knowledge regarding our five senses of our human body and its parts.
Grades:
PreK - 2nd, Higher Education

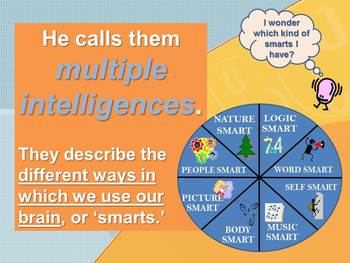
Multiple Intelligence (MI) SMARTboard (Secondary/Adult) by Jennifer A. Gates
Teaching gifted, talent development or preparing students for Common Core by teaching them to identify their strengths?
This is the perfect way to introduce Multiple Intelligence: 8 characteristics that students can use to best identify ways in which they can make positive growth. They are: nature smart, logic smart, self smart, people smart, word smart, picture smart, body smart, and music smart.
Introduce and explore Multiple Intelligence in depth with students the elementary or primary and
Grades:
5th - 12th, Higher Education, Adult Education, Staff
Types:

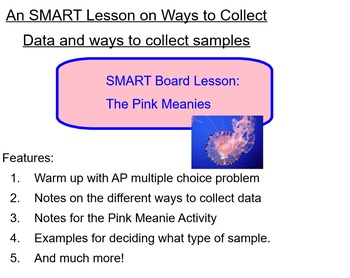
Statistics (SMART Board): Pink Meanies (Ways to Collect Samples)
This SMART lesson includes the following:
- A warm up with an AP multiple choice question
- Notes on different ways to collect data
- An activity on a census
- Notes for the Pink Meanie Investigative Task
- Examples of different types of sampling methods
- A closing the includes a card sort for the different types of sampling methods.
Subjects:
Grades:
11th - 12th, Higher Education

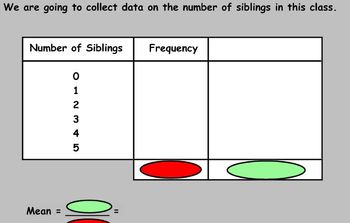
SmartNotebook Lesson - Calculating averages from a table
This notebook file can be used as an entire lesson to teach calculating averages from a table.
The first slide contains a starter asking students to find the mean, median and mode from sets of data. The second slide can be used to collect your own data in the class in order to show how to calculate the mean.
Following that there is another example, before finally showing two questions on the same slide which the students can work through.
Subjects:
Grades:
6th - 11th, Higher Education
Showing 1-4 of 4 results

