2 results
Martin Luther King Day statistics lectures for SMART Notebook

7th Grade Common Core Compound Probability
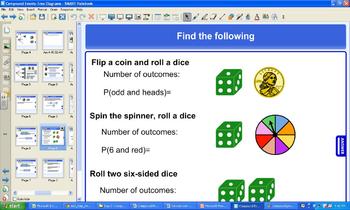
Students learn about independent and dependent probability through this lesson that uses lists, tree diagrams, etc. There is an notes page and assignment to accompany (under same title)
Subjects:
Grades:
7th - 8th

Using Models to Represent Ratios and Rates! SmartBoard Lesson / Scaffold Notes
In this SmartBoard lesson, students will learn how number lines, charts, tables and graphs can be used to represent unit rates, rates and ratios. Students will be given examples of how ratios are placed in tables/charts to see relationships and solve for unknowns. Students will see how double number lines are also used to represent rates and ratios. Lastly, students will see how line graphs, using x and y along with points can represent ratios and rates. There are examples of each for the class
Subjects:
Grades:
5th - 7th
Showing 1-2 of 2 results


