TPT
Total:
$0.00
Selected
Subjects
53 results

Science Common Core 8.F.B.5 resources
Preview of Distance-Time Graph Story Match: 7.P.1.3, 7.P.1.4, 8.F.5 - PRINT AND DIGITAL
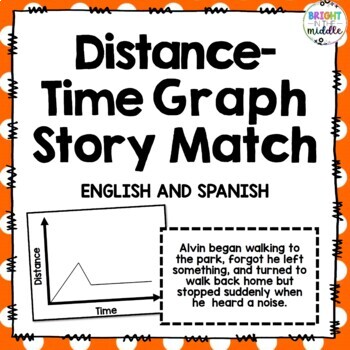
Distance-Time Graph Story Match: 7.P.1.3, 7.P.1.4, 8.F.5 - PRINT AND DIGITAL

This is not your average distance-time graph worksheet! This is a cut-and-glue activity that gets students engaged in learning common distance-time graphs related to real-life scenarios. Students learn the meaning of horizontal, diagonal, and curved lines. Students will not even realize that they are learning! Science and Math all in one!This activity covers 7.P.1.3, 7.P.1.4, and 8.F.5*A Spanish version and a digital version is now included!⭐Want a digital interactive lesson to go with this? Dis
Preview of Distance-Time Graph Interactive Google Slides Game for Google Classroom
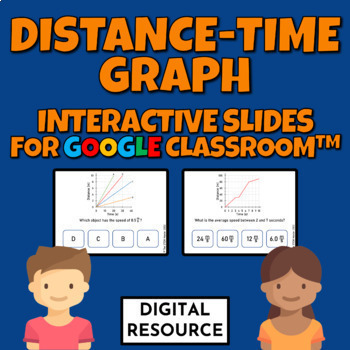
Distance-Time Graph Interactive Google Slides Game for Google Classroom

Created by
The STEM Master
Math, Physical science digital interactive Google Slides activity covering distance-time graphs, speed, velocity, time, distance, interpreting motion graphs. Digital interactive science task cards for Google Slides, Google Classroom, Digital resource Distance Learning.2 challenges with 10 self-checking multiple-choice questions each❗❗The students use the present mode and click on the correct answer to move to the next problem⚡️⚡️⚡️BIG Bundle of Physics⚡️⚡️⚡️⭐⭐⭐BIG Bundle of Chemistry⭐⭐⭐⭐Digital
Preview of Distance vs. Time Graphs

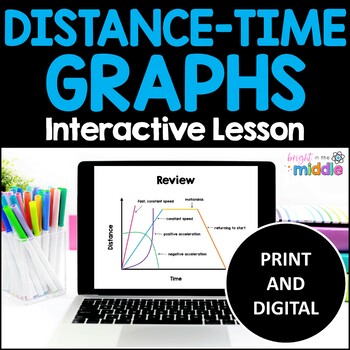
Distance vs. Time Graphs

This is an interactive lesson, review, and practice for teaching about distance-time graphs. This package includes a link for a Google slides version of the lesson a practice as well as a PowerPoint version. This lesson reviews many distance-time graphs examples.⭐ This distance vs. time graphs lesson is great for reducing cognitive load in the science classroom!A PRINT and DIGITAL version is included.So what is included?:Interactive lesson/review for:motiondistance versus time graphsgraphing con
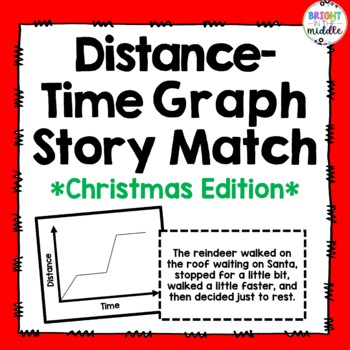
Preview of Christmas Edition: Distance-Time Graph Story Match: PRINT AND DIGITAL
Christmas Edition: Distance-Time Graph Story Match: PRINT AND DIGITAL

In this activity, students will read a story and match it to the correct distance-time graph. This is a cut-and-glue activity. Students of all ages love this! There are 7 stories in all. This activity is the *Christmas Edition* with Christmas-themed stories!Science and Math all in one, and now with a Google Slides version!This activity covers 7.P.1.3, 7.P.1.4, and 8.F.5It's important for students to understand distance-time graphs and how motion is graphed. This activity is an introduction to th
Preview of Distance-Time Graph Lesson with Interactive and Guided Notes: 7.P.1.3 & 7.P.1.4
Distance-Time Graph Lesson with Interactive and Guided Notes: 7.P.1.3 & 7.P.1.4

This lesson includes an interactive PowerPoint lesson in which students will take part in partner discussions, think-pair-shares, and body motions to help remember some common distance-time graphs. This lesson includes the PowerPoint lesson and guided notes.If you are more interested in a digital lesson with interactive components that is compatible with Google Slides, please look here!♥ Get this in the Distance-Time Graph Bundle!Distance-Time Graph BundleIt's important for students to understan
Preview of Distance-Time Graphs Worksheet - Tell Me A Story - 7.P.1.3, 7.P.1.4, and 8.F.5
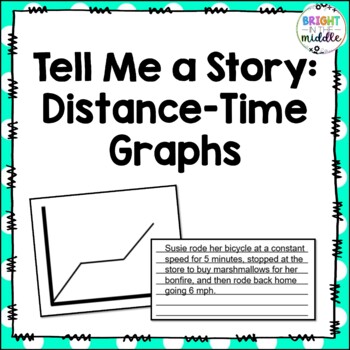
Distance-Time Graphs Worksheet - Tell Me A Story - 7.P.1.3, 7.P.1.4, and 8.F.5

Need a distance-time graphs worksheet/activity? It's Science and Math all in one! In this activity, students must create a story on what they believe the graph is showing. An example is given for them. This activity covers 7.P.1.3, 7.P.1.4, and 8.F.5.✅ Download the preview and check out the sneak peek inside!Want a interactive lesson to go with this?Distance-Time Graphs Digital Interactive LessonIt's important for students to understand distance-time graphs and how motion is graphed. This distan
Preview of Distance-Time Graph Story Match Bundle
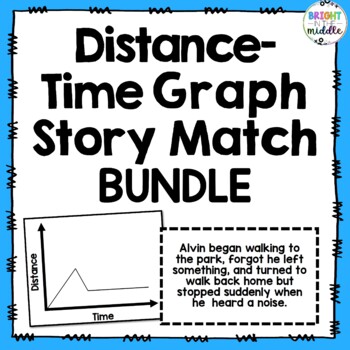
Distance-Time Graph Story Match Bundle

This bundle includes three of the distance-time graph story matches:1) Original Distance-Time Graph Story Match - ENGLISH and SPANISH2) Christmas Edition: Distance-Time Graph Story Match3) Valentine's Day Edition: Distance-Time Graph Story MatchIn these activities, students will read a story and match it to the correct distance-time graph. This is a cut-and-glue activity. Students of all ages love this! There are 7 stories in all.These activities are an introduction to the important "common grap
Preview of Analyzing Functions Activity - Gallery Walk 8.F.B.5
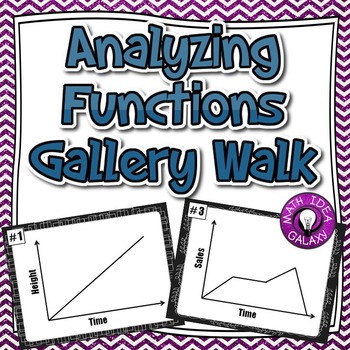
Analyzing Functions Activity - Gallery Walk 8.F.B.5

Created by
Idea Galaxy
Get students up and moving while analyzing functions with this gallery walk activity. Working in small groups or with a partner, students will analyze 6 different functions, drawing conclusions and deepening their understanding of how to look at and make meaning of functions in graphs. Supports 8th Grade CCSS 8.F.B.5 ***This activity is also included in the Analyzing Functions Activity Bundle with other great activities*** Included in this download: -6 graphs to analyze -student record shee
Preview of Valentine's Day Edition: Distance-Time Graph Story Match
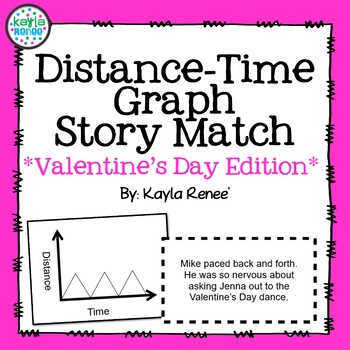
Valentine's Day Edition: Distance-Time Graph Story Match

In this activity, students will read a story and match it to the correct distance-time graph. This is a cut-and-glue activity. Students of all ages love this! There are 7 stories in all. This activity is the *Valentine's Day Edition* with Valentine's Day-themed stories!Science and Math all in one!This activity covers 7.P.1.3, 7.P.1.4, and 8.F.5It's important for students to understand distance-time graphs and how motion is graphed.This activity is an introduction to the important "common graphs"
Preview of Distance-Time Graphs Activity - Task Cards: 7.P.1.3, 7.P.1.4, 8.F.5
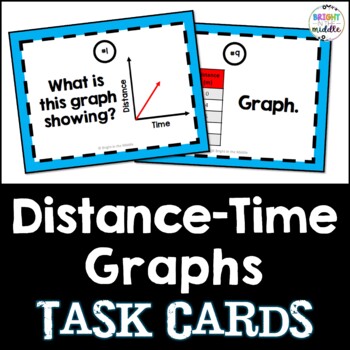
Distance-Time Graphs Activity - Task Cards: 7.P.1.3, 7.P.1.4, 8.F.5

Need a fun and engaging distance-time graph activity to teach and review these special type of graphs? These task cards will sharpen those skills that students need most while covering many state standards. Task Cards cover the following:- writing a story to describe a distance-time graph- creating distance-time graphs from scenarios- identifying key words- constant, stopped, and accelerating graphs- distance-time graphs and tablesThese task cards are great for RTI, Common Core Review, Regular C
Preview of Distance-Time Graphs Math Digital Boom Cards Digital Resource
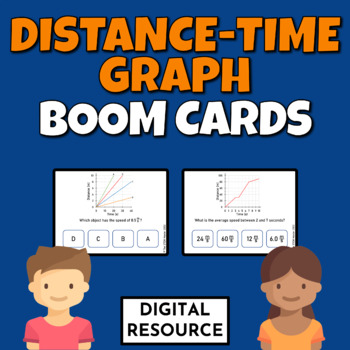
Distance-Time Graphs Math Digital Boom Cards Digital Resource

Created by
The STEM Master
Math, physical science digital interactive Boom Cards covering distance-time graphs, speed, velocity, time, distance, interpreting motion graphs. Digital resource Distance learning.20 cards▶️preview✅Interactive Google Slides version⚡️⚡️⚡️BIG Bundle of Physics⚡️⚡️⚡️⭐⭐⭐BIG Bundle of Chemistry⭐⭐⭐⭐Digital Chemistry Worksheets Bundle✅Physical Science Equation Worksheets Bundle✅Physical Science Graphing Digital Worksheets Bundle for Google Classroom™Common core assessments:✅✅✅Grade 3 Math CCSS Assessm
Preview of The Periodic Trends of Ionization Energy
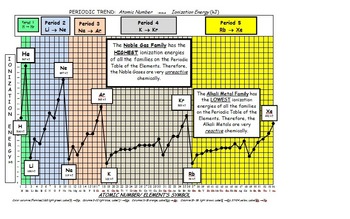
The Periodic Trends of Ionization Energy

Created by
CHEM by Gloria
This graphing activity, Atomic Number vs. Ionization Energy, will help students grasp a very difficult, but critical, concept in chemistry. This graphing activity includes 3 graphing worksheets for varying levels of ability. Data sheets of the first 54 elements and their ionization energies are also included. A completed graph is included. Students will observe how ionization energy changes from left to right across the periodic table and from top to bottom of a family. These worksheets will h
Preview of Concept Comparison: Graphs in Science (Categorical vs Numerical)
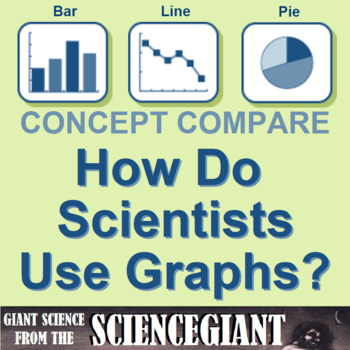
Concept Comparison: Graphs in Science (Categorical vs Numerical)

Created by
TheScienceGiant
How do scientists use graphs? This concept comparison helps students contrast bar graphs, pie charts and line graphs created from categorical and numerical data. The recall device uses DRY MIX and TRAILS as acronyms to help Ss remember how variables are plotted on a graph, and standard format for a graph. The frame comparison helps students contrast rate of change, slope shape and written relationships of functions (y vs. x; y vs. x^2; y vs. 1/x, and so on). THREE (3) activities are included:ha
Preview of Scientific Thinking Unit Bundle

Scientific Thinking Unit Bundle

3 fully editable, NGSS/modeling pedagogy aligned worksheets, 4 inquiry labs, 3 lab challenges, 2 quizzes, 6 guided notes/reading assignments, 1 unit review, 1 writing assignment, 1 equation toolbox, and 1 curriculum guide!WorksheetsThere are a variety of free response questions for most worksheets, which are usually one or two pages long. Worksheets are used for students to deploy models developed from inquiry labs and as a way to practice problem-solving en route to mastery of learning targets
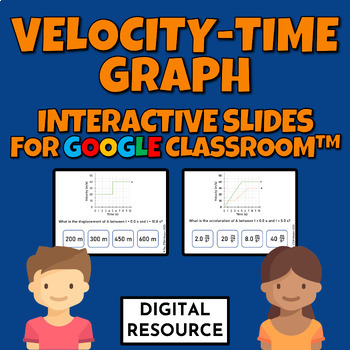
Preview of Velocity-Time Graph Interactive Google Slides Game for Google Classroom
Velocity-Time Graph Interactive Google Slides Game for Google Classroom

Created by
The STEM Master
Math, Physical science digital interactive Google Slides activity covering velocity-time graphs, acceleration speed, velocity, time, distance, interpreting motion graphs. Digital interactive science task cards for Google Slides, Google Classroom, Digital resource Distance Learning.2 challenges with 10 self-checking multiple-choice questions each❗❗The students use the present mode and click on the correct answer to move to the next problem⚡️⚡️⚡️BIG Bundle of Physics⚡️⚡️⚡️⭐⭐⭐BIG Bundle of Chemistr
Preview of Spring Action Lab: A Bouncy and Engaging STEM Lab
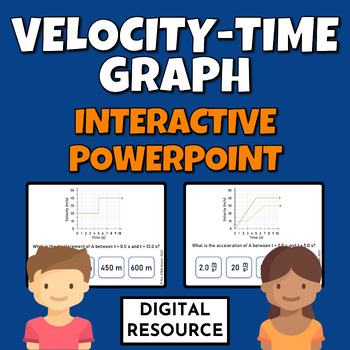
Spring Action Lab: A Bouncy and Engaging STEM Lab

Students will enjoy putting their learning to work in this engaging lab. Using springs or rubber bands, students measure and record data as they try to get a bucket to touch the floor by adding weights. Then they use their data and its graph to make predictions and write equations that will help them predict the outcomes. This simple and inexpensive lab will help your students learn graphing, t-tables, measurement, linear functions, and the physics of tension forces. This can be used as a stand-
Preview of Velocity Time Graph Interactive Powerpoint Digital Resource
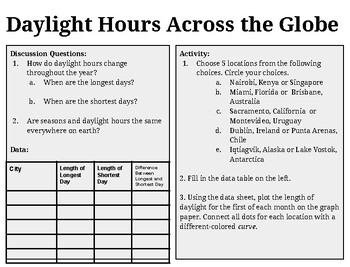
Velocity Time Graph Interactive Powerpoint Digital Resource

Created by
The STEM Master
Math, Physical science digital interactive PowerPoint activity covering desctibing motion, velocyty-time graphs, speed, velocity, time, distance, interpreting motion graphs. Digital interactive science task cards Digital Resource Distance Learning.2 challenges, 10 multiple choice self-checking problems each❗❗ Instructions: The students go to the first slide and use the slide show mode. A correct answer gives the next problem and incorrect returns to the same problem.Digital product - no prep!✅In
Preview of Daylight Hours Across the Globe

Daylight Hours Across the Globe

Created by
Dewey Does It
There are many aspects of the Earth-Sun-Moon cycle that can be difficult for students to visualize. Included among these are how daylight changes depending on latitude. This activity intends to provide students with actual data from different locations on Earth at different latitudes that can provide an obvious visual demonstrating this scientific fact. Included in this assignment is a map of the Earth with major latitude lines, daylight data for 8 locations, latitude data for both northern and
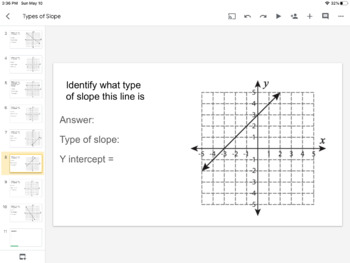
Preview of Types of Slope & Y Intercept: Interactive Distance Learning Google Classroom
Types of Slope & Y Intercept: Interactive Distance Learning Google Classroom

Created by
Raffi Sarajian
This is a great interactive online lesson which is compatible for google classroom and distance learning to help students get familiar with the different types of slope, (positive, negative, zero, undefined). Also the students will practice finding and Identifying the Y-intercept as well. Students will use the interactive activity to practice the skills required to move onto linear equations. Great tool to use to make a screen-cast video for your students!
Preview of Tracking Hurricane Sandy!

Tracking Hurricane Sandy!

Created by
Get Science
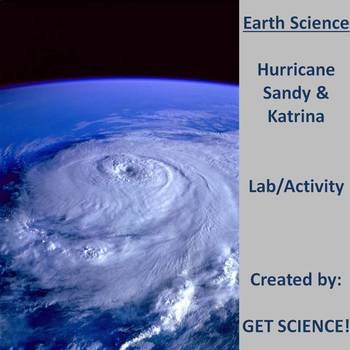
This 6 page lab activity will help students remember where hurricanes form and why. The lab explores the differences and similarities between Hurricane Sandy and Hurricane Katrina. Students will practice their skill of plotting using latitude and longitude as they plot the tracks of both. The Saffir-Simpson scale will be used as students analyze data from both storms. Students will plot pressure vs. wind speed to understand the relationship and answer questions based on the data and general h
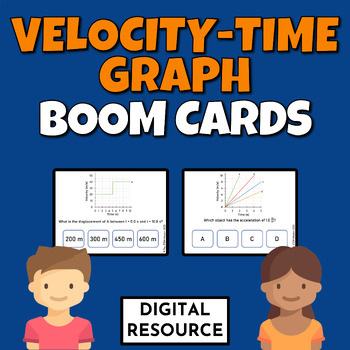
Preview of Velocity-Time Graphs Math Science Boom Cards Digital Resource
Velocity-Time Graphs Math Science Boom Cards Digital Resource

Created by
The STEM Master
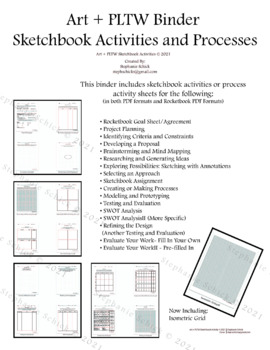
Math, physical science digital interactive Boom Cards covering velocity-time graphs, acceleration speed, velocity, time, distance, interpreting motion graphs. Digital resource Distance learning.20 cards▶️preview✅Interactive Google Slides version⚡️⚡️⚡️BIG Bundle of Physics⚡️⚡️⚡️⭐⭐⭐BIG Bundle of Chemistry⭐⭐⭐⭐Digital Chemistry Worksheets Bundle✅Physical Science Equation Worksheets Bundle✅Physical Science Graphing Digital Worksheets Bundle for Google Classroom™Common core assessments:✅✅✅Grade 3 Math
Preview of PLTW, Science and Art Processes and Activities Binder
PLTW, Science and Art Processes and Activities Binder

Created by
Winter Studios
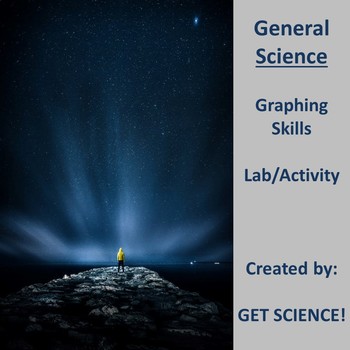
Art + PLTW + Science BinderSketchbook Activities and ProcessesThis binder includes (in both PDF formats and Rocketbook PDF Formats) sketchbook activities or process activity sheets for the following:• Rocketbook Goal Sheet/Agreement• Project Planning• Identifying Criteria and Constraints• Developing a Proposal• Brainstorming and Mind Mapping• Researching and Generating Ideas• Exploring Possibilities: Sketching with Annotations• Selecting an Approach• Sketchbook Assignment• Creating or Making Pro
Preview of Human Population Graphing Lab

Human Population Graphing Lab

Created by
Get Science
This simple yet effective lab allows students to strengthen their graphing skills using real word data. Students will deal with larger numbers as they see the exponential growth of the global population.Students will practice rate of change problems and scientific notation. Students will also make observations and inferences on their findings.You may edit this lab. Answer key and Graph Paper provided. Website for current world population in real time provided.Educating the World Together!
Preview of MATH LESSON & MATH LAB - The Fibonacci Sequence

MATH LESSON & MATH LAB - The Fibonacci Sequence

Created by
Jean's MATH
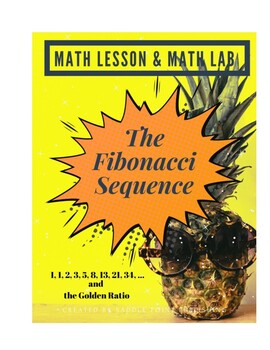
Have students discover, for themselves, both the Fibonacci sequence and the golden ratio in this very fun lesson about patterns!This is a tried and true math lesson and lab that I have created and used for many years with my 7th and 8th grade classes. Students use a fancy formula derived by mathematician Jacques Philippe Marie Binet that will figure out any number in the Fibonacci sequence. And, they find out more about the special number phi. In the MATH LESSON, students will ...evaluate an exp
Showing 1-24 of 53 results

Find Science resources | TPT

Importance of learning science

Learning science is particularly important for students as it equips them with the essential knowledge and skills to make sense of the world around them. Science education is not just about memorizing facts. It fosters critical thinking, inquiry, and problem-solving abilities. These skills are not only useful in school but also in everyday life beyond the classroom.

Benefits of learning science

Learning science offers many benefits to students both in school and beyond. In fact, it helps students:

  • Question the world around them and seek evidence-based explanations
  • Cultivate their ability to observe, experiment, and analyze data
  • Nurture a sense of curiosity, awe, and wonder about the natural world
  • Understand natural phenomena and the laws that govern the universe

With a solid foundation in science, teachers can help empower students to think critically, solve problems, make informed decisions, and engage with the world around them in meaningful ways.

Teaching with science resources

One of the best parts about science class is all of the possibilities for hands-on, collaborative learning! Think: labs, experiments, inquiry-based activities, and design challenges. These activities encourage students to explore scientific concepts by observing, asking questions, and conducting investigations. Additionally, with small group centers, students can engage in group experiments, discussions, and projects that require them to collaborate, share ideas, and solve problems together.

Discover printable and digital science resources

If you’re a teacher or parent looking for printable or digital science resources, TPT has an extensive array of instructional materials for every learning need, topic, or grade level. Whether you're learning about plant parts or butterfly life cycles, or exploring advanced topics like the anatomy of a cell or Newton’s laws of motion, we've got you covered.

On TPT, science resources come in various forms: from labs and worksheets to craftivities and doodle notes. They can be used to enhance learning, assess a student’s mastery of science concepts, or to reteach a tricky topic. With plenty of TPT resources at your fingertips, teaching and learning science will be so much easier. Plus, you can expand students’ knowledge even further by exploring TPT math resources, which are frequently paired with science lessons.

Frequently asked questions about teaching science

What types of science lessons are available on TPT?

There are many different types of science resources sold by Sellers on TPT. Some popular science lessons include biology, earth sciences, chemistry, environment, engineering, and anatomy.

How do I find science lessons on TPT?

Educators can save time preparing science lessons with resources created by experienced teachers. Simply start a search for science resources on the TPT marketplace, and filter by grade level, price, and/or resource type to find materials that've been proven to work in classrooms like yours. No matter what you’re teaching, there are plenty of science lessons and activities sold by Sellers on TPT that are tailored to meet your students' skill levels.

How can I make my science lessons fun and engaging?

Students learn best when they're engaged! Sprinkle a little fun into your science lessons and make them feel like real scientists by investigating everyday objects, exploring the world outside the classroom, and doing hands-on and collaborative experiments and design challenges.