5 results
Biology Common Core HSS-ID.A.1 resources
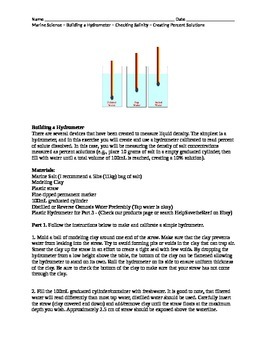
Marine Science Biology Making a Hydrometer Making Percent Solutions
This laboratory experience enables students to create a hydrometer using clay and straws to measure unknown solutions. Students begin by calibrating their devices using percent solutions that they must make. They can then use their device to measure unknown solutions provided by the instructor. Students are asked to convert units of measure. Additional research questions are provided that go beyond the laboratory activity.
Subjects:
Grades:
9th - 12th, Adult Education
Types:
CCSS:
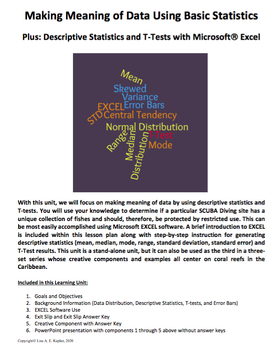
Making Meaning of Data Using Basic Statistics – Plus Statistics with EXCEL
This learning unit includes two files – a PDF document and a PowerPoint presentation. The PDF includes the following components and can be used solely by the teacher or modified to remove the assessment pieces and distributed to the students. 1. Goals and Objectives2. Background Information a. Data Distribution, Descriptive Statistics, T-tests, and Error Barsb. EXCEL Software Use3. Assessmentsa. Exit Slip and Exit Slip Answer Keyb. Creative Component with Answer Key All of the background info
Subjects:
Grades:
7th - 10th
CCSS:
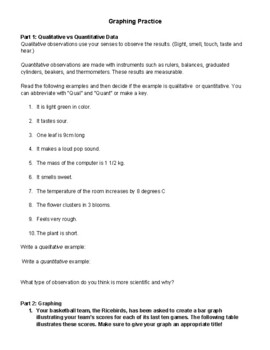
Graphing and Data Analysis Practice
A good practice for a high school science class after teaching students about different types of graphs and quantitative vs qualitative data. Can be used as an independent work packet in class or homework. Perfect for a remote assignment!
Subjects:
Grades:
8th - 12th
CCSS:
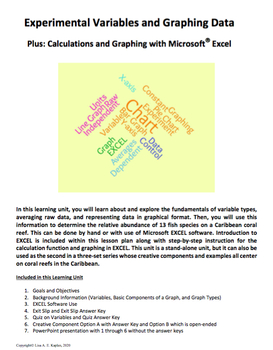
Experimental Variables and Graphing
This learning unit includes two files – a PDF document and a PowerPoint presentation. The PDF includes the following components and can be used solely by the teacher or modified to remove the assessment pieces and distributed to the students. 1. Goals and Objectives2. Background Information a. Variables, Components of a Graph, Graph Typesb. EXCEL Software Use3. Assessmentsa. Exit Slip and Exit Slip Answer Keyb. Quiz on Variables and Answer keyc. Creative Component Options A with Answer Key and
Subjects:
Grades:
7th - 9th
CCSS:
Learn-a-long: 'Nice Genes!' Episode 5
The download is a PDF for students to help follow along with Episode 5 of the Nice Genes! Podcast found HEREJust like any good superhero comic, we start this episode with the science going incredibly wrong. Think: vats of toxic waste producing evil mutants that ravage the city. Or maybe not so evil. It really depends on your perspective. Just like the X-men, genetic mutations get a bad rap in the public eye. But they aren’t all nasty.Dr. Kaylee Byers speaks with data scientist and evolutionary b
Subjects:
Grades:
8th - 12th, Higher Education, Adult Education
Types:
CCSS:
Showing 1-5 of 5 results


