18 results
Graphing lessons for Montessori on sale
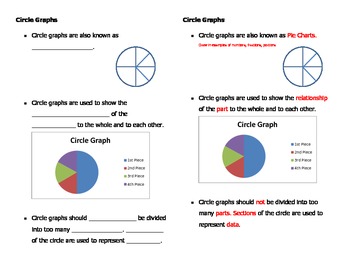
Construct, Compare, Interpret Circle Graphs
Mini Unit: Circle graphs are studied through several guided lessons and independent practice worksheets. Guided notes examine circle graphs and the types of data they represent and are perfect for your interactive notebook. Graphs are constructed to and from a bar graph. Problems involve evaluating and interpreting data through the percents, portions, and fractions represented by graphs. For use in upper elementary and middle school exceptional and general education classrooms.
Subjects:
Grades:
4th - 9th
The Great Scientific and Mathematical Pumpkin Investigation (for the big kids!)
Older kids can have fun with pumpkins too! In this investigation, students will observe characteristics, make predictions, and collect scientific and mathematical data from a pumpkin. They will find the total mass, measure the height and circumference, as well as check for buoyancy.
Once the teacher cuts the pumpkin open, students will collect more data about their pumpkin, such as: the mass of the seeds, the mass of the pulp, measure the largest seed in the pumpkin, and then measure the sma
Subjects:
Grades:
4th - 8th
Types:
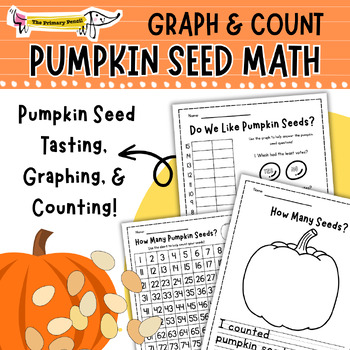
Pumpkin Seed Taste, Vote, Graph, & Count | K-2 October Math Activities & Lesson
Integrate science and math with Pumpkin Seed Graph & Count! Designed for educators, parents, and caregivers of young learners in K-2, this October resource offers a hands-on and interactive lesson plan that combines sensory experiences with foundational math and graphing skills. Update your pumpkin study with this engaging resource!Product Features:Lesson Plan: Includes generalized lesson plans with book recommendations that guide educators! Make it your own or follow the guide.2 Voting Page
Grades:
PreK - 2nd
Types:
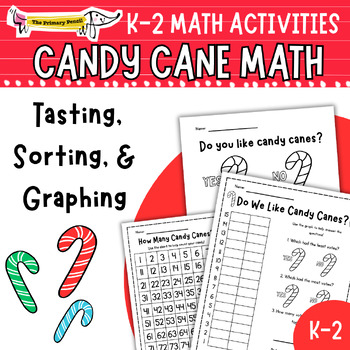
Candy Cane Taste, Graph, & Sort| K-2 Winter Math Snack Activities & Lesson
Holiday Math AND Candy Canes - What student wouldn't LOVE this? Try out Candy Cane Math - Taste, Graph, & Sort! Created for young learners in K-2, this December resource offers a hands-on and interactive lesson plan that combines sensory experiences with foundational math and graphing skills. Perfect for holiday parties, math extensions, and hands-on learning!Product Features:Lesson Plan: Includes generalized lesson guides that guide educators in implementation! Make it your own or follow t
Subjects:
Grades:
K - 2nd
Types:
Also included in: Candy Cane Math & Science Activity Bundle | Christmas Hands-On Learning!
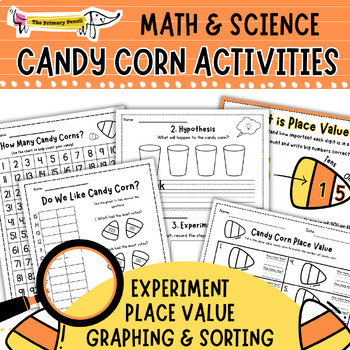
Candy Corn Math & Science Activity Bundle | Halloween Hands-On Learning!
Math, Science, Candy Corn, and Halloween - What student wouldn't LOVE be engaged? Try out The Primary Pencil's Candy Corn Math & Science Activity Bundle! Designed for educators, parents, and caregivers of young learners in K-2, this October resource offers hands-on and interactive lesson plans that combine sensory experiences, scientific investigations, and foundational math skills. Perfect addition to your October themed learning or Halloween!Product Bundle Features:Candy Corn Science Expe
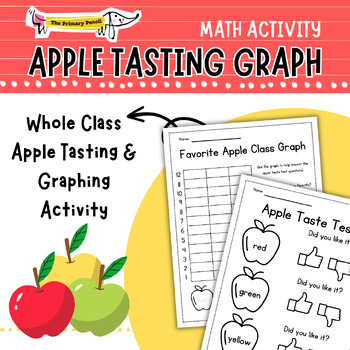
Apple Tasting Bar Graphing Math Activity | K-2 Math Lesson on Data Collection
Are you looking for an exciting and educational activity to captivate young minds while teaching them essential math and data skills? Look no further than The Primary Pencil's K-2 Apple Tasting Bar Graphing Activity! Designed for early elementary classrooms, this hands-on experience combines the fun of apple tasting with fundamental graphing concepts.Product Features:4 Apple Taste Test Data Collection Pages: As students taste each apple and record their preferences, they are actively engaged in
Grades:
PreK - 2nd
Types:
Also included in: Apple Tasting Math & Science Activity Bundle | K-2 September Apply Study
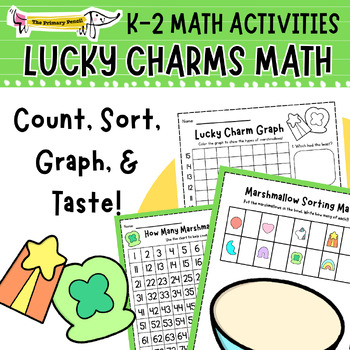
Lucky Charms Sort, Graph, & Taste Math Activities | St. Patrick's Day Snack K-2
Grab this interactive Lucky Charms Math Activities pack for St. Patrick's Day sorting & counting fun! Use Lucky Charms as the foundation for interactive sorting, graphing, and a delightful class tasting (Lucky charms NOT included ;) This resource is guaranteed to add a sprinkle of sweet fun to your math lessons while reinforcing essential skills.Product Features:Lesson Plan Includes lesson guides that guide educators in implementation! Make it your own or follow the guide.Lucky Charm Sort &
Subjects:
Grades:
K - 2nd
Types:
Also included in: Lucky Charms Math & Science Activity Bundle | March Hands-On Learning!
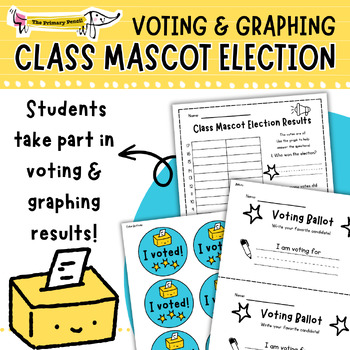
Class Mascot Voting Math Activity | K-2 Election Lesson With Bar Graphing & MORE
Get your youngest voters excited about election day with this Class Mascot Voting Activity! This resource encourages student participation, critical thinking, and introduces them to the democratic process from casting their voting ballots in the ballot box, getting "I Voted" buttons, and an engaging class bar graphing activity!This resource is part of an Integrated Project-Based Learning (PBL) experience for K-2 learners, Class Mascot Election!Product Features:Real-Life Voting Experience: Our vo
Subjects:
Grades:
K - 2nd
Types:
Also included in: Class Mascot Election! | Project-Based Learning K-2 Bundle | Voting
Math Champs! Tables, Charts, and Graphs
This book helps students learn about many types of tables and graphs. Practice includes constructing tables, charts, stem-and-leaf plots, picture graphs, circle graphs, bar graphs and line graphs. These pages may be assigned as a class lesson, individual seat work, or homework activities.
Subjects:
Grades:
6th - 8th
Types:
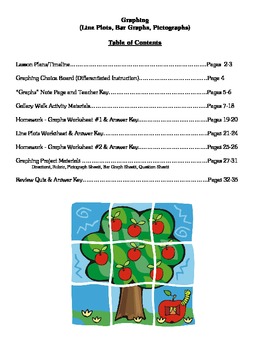
Graphs (Bar, Pictographs, Line Plots) - Math Lesson Unit & Materials
Are you looking for a unit on Graphs (Line Plots, Bar Graphs, and Pictographs) that has differentiated activities along with all the materials you need to teach the entire unit? Are you tired of just teaching from the textbook and want something different to do with your class? If so, this packet of materials is literally all that you need – an overall unit outline for 7 days of activities, a note page with teacher key, suggested homework assignments, class activities (both regular and differe
Grades:
3rd - 4th
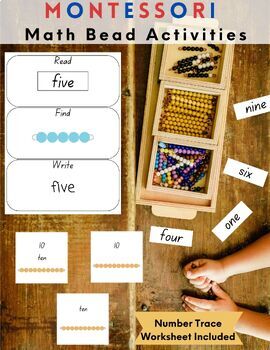
Montessori Math Bead Activity & Flash Cards 1-10
Montessori Math Bead Activity 3 Variations of number flash cardsLaminate for long term use!Ready to print PDFFollow to be notified first about new learning resources!I am a new creator and would love your feedback!Thank you for your purchase!
Grades:
PreK - 5th
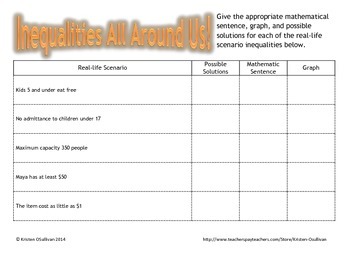
Real Life Scenarios: Inequalities Activity
Activity combines practical math along with math solutions in various formats. Students are asked to provide possible solutions, demonstrate a graph, and write an inequality as a math sentence for real-life scenarios. This is a great tool for guided or independent practice. Students can use as an introduction to inequalities or as a review item. Recommended for middle school or early secondary classrooms in the general or special education setting.
Subjects:
Grades:
5th - 10th
Types:
Bar & Line Graphs Lesson Unit with materials - Math
Are you looking for a complete lesson unit on Bar and Line Graphs that has all the materials you need to teach the entire unit? Are you tired of just teaching from the textbook and want something different to do with your class? If so, this packet of materials is literally all that you need – a 7-day unit with activities, a note page with teacher key, suggested homework assignments, class activities, and a unit review test.
You will get:
A lesson unit outline (7 days)
Note page with teacher
Grades:
4th - 5th
Types:
Graphs Activities (Bar, Pictographs, Line Plots) - Math Ideas
Are you struggling to find activities for teaching about graphs, in particular line plots, bar graphs, and pictographs? Well, look no further! This packet of materials includes the following:
Differentiated Activity Choice Board
Gallery Walk Materials
Graphing Project Direction & Materials
**If you teach in Virginia, this unit of study specifically correlates to Math, SOL 3.17.
Samples are provided if you want to take a look.
FYI--I have also listed a complete 7-day lesson unit on Gr
Grades:
3rd - 4th
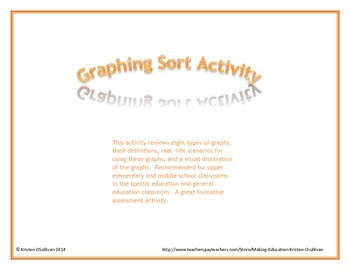
Graphing Types Activity Sort
This activity reviews eight types of graphs. Using a cut and paste/sort activity students will review descriptions for each type of graph. Then students will provide a real-life scenario and draw the appropriate graph to complete the chart. Great resource for an interactive notebook. Recommended for upper elementary and middle school classrooms in the special education and general education classroom. A great formative assessment activity or for use at a math center. SOLs 8.13, 6.14
Subjects:
Grades:
4th - 9th
Types:
Lines, points and Planes
This is a 15 slides Power Point presentation that covers Points, Lines and Planes. It contains the definitions of points, lines and planes with good examples.
My Quizzes:
4th Grade Word Problems Quiz (10 Q)
Equations and Inequalities Quiz (20 Questions)
An Introduction to Functions Quiz (11 Questions)
Evaluate Expressions Quiz (22 questions)
Pairs of Lines Quiz (17Q)
Types of Angles Quiz (10 Q)
Increasing Growth Pattern Quiz (10 Q)
Compare and Order Decimals Quiz (10 Q)
Ratio Q
Graphing on the Coordinate Plane (PowerPoint Presentation)
Graphing on the Coordinate Plane.
It contains 11 slides of:
Vocabulary – Coordinate Plane
Plotting Points
Quadrants
Index card graphing
A R Mathematics
Grades:
6th - 10th
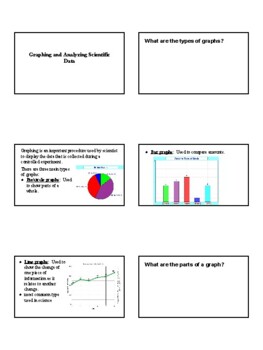
Graphing and Analyzing Scientific Data (editable presentation)
Graphing and Analyzing Scientific Data What are the types of graphs? Graphing is an important procedure used by scientist to display the data that is collected during a controlled experiment.this document explains ways to analyze data:● graphing:○ extrapolate○ interpolate○ calculate● statistics○ mean, median, mode○ standard deviation○ % error
Subjects:
Grades:
6th - 12th, Staff
Showing 1-18 of 18 results


