35 results
Statistics resources for Google Apps on sale
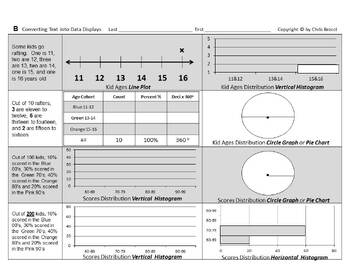
Stats&Data Slides Bundle C: Data Displays Measures of Central Tendency Variation
From the Author of Bossy BrocciMath & Big Science workbooks on Amazon,comes student fillable editable interactiveGoogle Slides™ for Google Classroom™ Students can insert/overlay text & graphics[textboxes, shapes, lines, arrows, colors etc.]onto the G-Slide image backgroundorConvert to PDF, then make it interactive onlineby using various third-party Ed. websitesorPrint it for paper worksheets=======================This Bundle of Data Displays,Measures of Central Tendency(Mean, Median, M
Subjects:
Grades:
Not Grade Specific
Types:
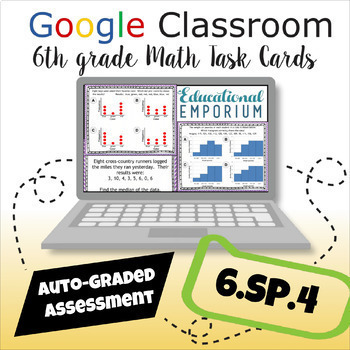
6.SP.4 Math Task Cards SELF-GRADING 6th Grade ★ Displaying Numerical Data
Plotting Data on Number Lines, Including Dot Plots, Histograms, and Box Plots Task Cards for 6th Grade Math Centers: These 12 digital task cards (2 sets of 6) are aligned with Common Core Standards 6.SP.4: Displaying Numerical Data in Plots on a Number Line, Including Dot Plots, Histograms, and Box Plots. Designed to make the classroom efficient and interactive, these task cards are presented as a self-grading Google Form that automatically generates a spreadsheet of student scores, making gradi
Grades:
5th - 7th
Types:
CCSS:
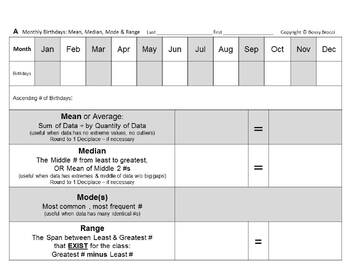
Stats&Data Slides Bundle B: Birthdays Data Displays Variation Mean Median Mode
From the Author of Bossy BrocciMath & Big Science workbooks on Amazon,comes student fillable editable interactiveGoogle Slides™ for Google Classroom™ Students can insert/overlay text & graphics[textboxes, shapes, lines, arrows, colors etc.]onto the G-Slide image backgroundorConvert to PDF, then make it interactive onlineby using various third-party Ed. websitesorPrint it for paper worksheets=======================This Birthdays Stats (Mean, Median, Mode, Range),Measures of Variation &am
Subjects:
Grades:
Not Grade Specific
Types:
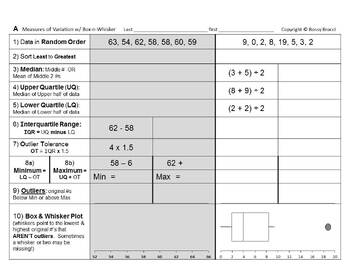
Stats&Data Slides Bundle A: Measures of Variation Box & Whisker Box Plots
From the Author of Bossy BrocciMath & Big Science workbooks on Amazon,comes student fillable editable interactiveGoogle Slides™ for Google Classroom™ Students can insert/overlay text & graphics[textboxes, shapes, lines, arrows, colors etc.]onto the G-Slide image backgroundorConvert to PDF, then make it interactive onlineby using various third-party Ed. websitesorPrint it for paper worksheets=======================This Measures of Variation Box & WhiskerBox Plots Bundlecontains:4 Les
Subjects:
Grades:
Not Grade Specific
Types:

NO PREP ⭐ Summarize Numerical Data Sets 6th Grade Math Escape Room ⭐ 6.SP.5
Digital Escape Room, 6.SP.5: This no-prep math escape room is a fantastic way to review summarizing numerical data set according to its context in 6th grade! Students love working together to solve the clues in this escape activity. The escape room is digitally controlled and is perfect for laptops, desktops, iPads, Chromebooks, and tablets of all brands and operating systems! No add-ons, extensions, or extra preparation is required: only the internet browser included on your device. This escape
Subjects:
Grades:
5th - 7th
Types:
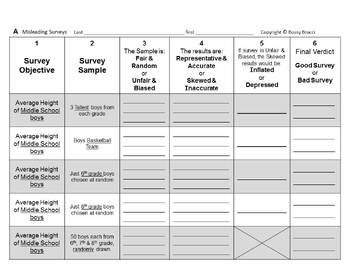
Stats&Data Slides Bundle D: Misleading Misinterpreting Surveys Statistics Graphs
From the Author of Bossy BrocciMath & Big Science workbooks on Amazon,comes student fillable editable interactiveGoogle Slides™ for Google Classroom™ Students can insert/overlay text & graphics[textboxes, shapes, lines, arrows, colors etc.]onto the G-Slide image backgroundorConvert to PDF, then make it interactive onlineby using various third-party Ed. websitesorPrint it for paper worksheets=======================This Bundle onMisleading & MisinterpretingSurveys, Statistics, and Gr
Subjects:
Grades:
Not Grade Specific
Types:
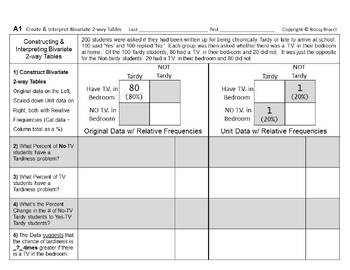
Stats&Data Slides 12: Construct Analyze Bivariate Two-way Frequency Data Tables
From the Author of Bossy BrocciMath & Big Science workbooks on Amazon,comes student fillable editable interactiveGoogle Slides™ for Google Classroom™ Students can insert/overlay text & graphics[textboxes, shapes, lines, arrows, colors etc.]onto the G-Slide image backgroundorConvert to PDF, then make it interactive onlineby using various third-party Ed. websitesorPrint it for paper worksheetsANSWER KEY included=======================Students will:1) Construct a Pair of Raw and Unit/Simpl
Subjects:
Grades:
Not Grade Specific
Types:
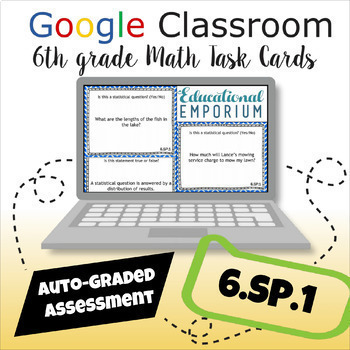
6.SP.1 Task Cards 6th Grade Math AUTO-GRADED Google Form ★ Statistical Questions
Asking Statistical Questions Task Cards for 6th Grade Math Centers: These 12 digital task cards (2 sets of 6) are aligned with Common Core Standard 6.SP.1: Recognize a Statistical Question as One that Anticipates Variability in the Data Related to the Question and Accounts for it in the Answers. Designed to make the classroom efficient and interactive, these task cards are presented as a self-grading Google Form that automatically generates a spreadsheet of student scores, making grading papers
Grades:
5th - 7th
Types:
CCSS:
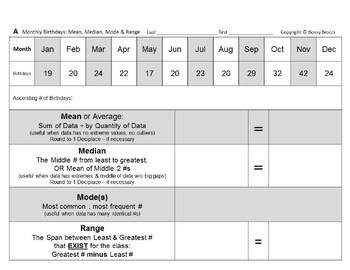
Stats&Data Slides 10: Author Birthdays Variation Central Tendency Data Displays
From the Author of Bossy BrocciMath & Big Science workbooks on Amazon,comes student fillable editable interactiveGoogle Slides™ for Google Classroom™ Students can insert/overlay text & graphics[textboxes, shapes, lines, arrows, colors etc.]onto the G-Slide image backgroundorConvert to PDF, then make it interactive onlineby using various third-party Ed. websitesorPrint it for paper worksheetsAnswer KEY included=======================Students will:1) Convert the given Monthly Birthdaysfro
Subjects:
Grades:
Not Grade Specific
Types:
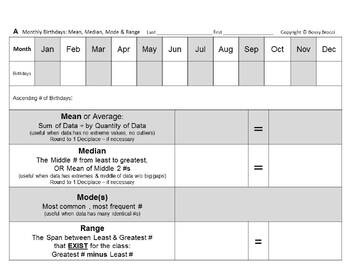
Stats&Data Slides 11: YOUR Birthdays Variation Central Tendency Data Displays
From the Author of Bossy BrocciMath & Big Science workbooks on Amazon,comes student fillable editable interactiveGoogle Slides™ for Google Classroom™ Students can insert/overlay text & graphics[textboxes, shapes, lines, arrows, colors etc.]onto the G-Slide image backgroundorConvert to PDF, then make it interactive onlineby using various third-party Ed. websitesorPrint it for paper worksheets=======================Students will:1) Convert a Monthly Birthdays tallyfrom YOUR School or Clas
Subjects:
Grades:
Not Grade Specific
Types:
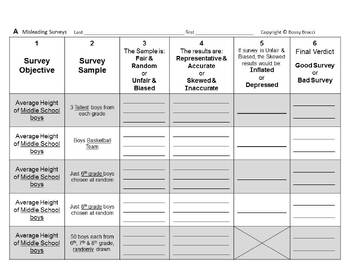
Stats&Data Slides 13: Misleading & Misinterpreting Surveys & Statistics + QUIZ
From the Author of Bossy BrocciMath & Big Science workbooks on Amazon,comes student fillable editable interactiveGoogle Slides™ for Google Classroom™ Students can insert/overlay text & graphics[textboxes, shapes, lines, arrows, colors etc.]onto the G-Slide image backgroundorConvert to PDF, then make it interactive onlineby using various third-party Ed. websitesorPrint it for paper worksheetsANSWER KEY included=======================Students will:1) Read 10 different Surveys and Survey S
Subjects:
Grades:
Not Grade Specific
Types:
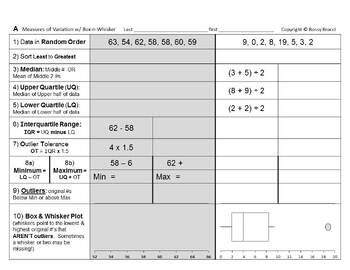
Stats&Data Slides 06: Quartiles Interquartile Range Outliers Box Whisker Plots
From the Author of Bossy BrocciMath & Big Science workbooks on Amazon,comes student fillable editable interactiveGoogle Slides™ for Google Classroom™ Students can insert/overlay text & graphics[textboxes, shapes, lines, arrows, colors etc.]onto the G-Slide image backgroundorConvert to PDF, then make it interactive onlineby using various third-party Ed. websitesorPrint it for paper worksheetsAnswer KEY included=======================Students will:1) Sort or Sequence 8 different Data Sets
Subjects:
Grades:
Not Grade Specific
Types:
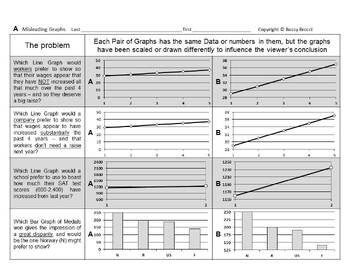
Stats&Data Slides 14: Misleading & Misinterpreting Data Graphs Charts Statistics
From the Author of Bossy BrocciMath & Big Science workbooks on Amazon,comes student fillable editable interactiveGoogle Slides™ for Google Classroom™ Students can insert/overlay text & graphics[textboxes, shapes, lines, arrows, colors etc.]onto the G-Slide image backgroundorConvert to PDF, then make it interactive onlineby using various third-party Ed. websitesorPrint it for paper worksheetsANSWER KEY included=======================Students will:1) Analyze 20 different Graphs or Data Di
Subjects:
Grades:
Not Grade Specific
Types:
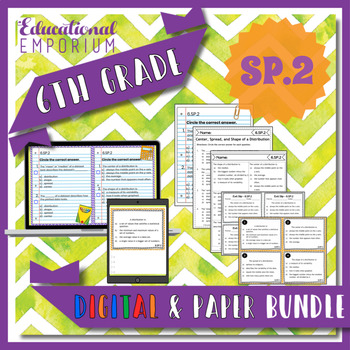
6.SP.2 Bundle ⭐ Center, Spread, and Shape of Distribution
Describing a Distribution by its Center, Spread, and Shape Resource Bundle for 6th Grade Math Centers: These 10 paper and digital resources are aligned with Common Core Standard 6.SP.2: Center, Spread, and Shape of Distributions. These Exit Slips, Task cards, Worksheets, Quizzes, and Interactive Notebooks are great for whole-class games, math centers/stations, fast finishers, extra practice, homework, scavenger hunts, quiz-quiz-trade, morning work, small groups, or review for test. All of the pr
Grades:
5th - 7th
Types:
CCSS:
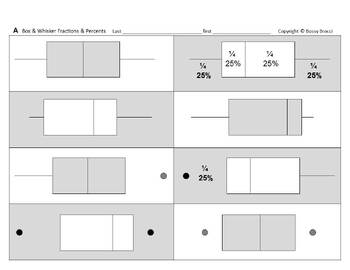
Stats&Data Slides 08: Convert Label Box and Whisker Plots to Fractions Percents
From the Author of Bossy BrocciMath & Big Science workbooks on Amazon,comes student fillable editable interactiveGoogle Slides™ for Google Classroom™ Students can insert/overlay text & graphics[textboxes, shapes, lines, arrows, colors etc.]onto the G-Slide image backgroundorConvert to PDF, then make it interactive onlineby using various third-party Ed. websitesorPrint it for paper worksheetsAnswer KEY included=======================Students will:1) Analyze 16 Box & Whisker Plots (Bo
Subjects:
Grades:
Not Grade Specific
Types:
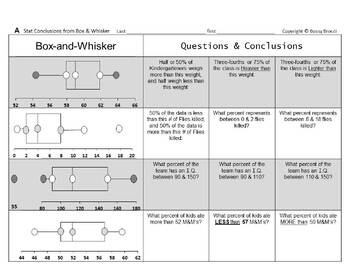
Stats&Data Slides 09: Statistical Conclusions from Box and Whisker Plots QUIZ
From the Author of Bossy BrocciMath & Big Science workbooks on Amazon,comes student fillable editable interactiveGoogle Slides™ for Google Classroom™ Students can insert/overlay text & graphics[textboxes, shapes, lines, arrows, colors etc.]onto the G-Slide image backgroundorConvert to PDF, then make it interactive onlineby using various third-party Ed. websitesorPrint it for paper worksheetsAnswer KEY included=======================Students will:1) Analyze 8 Box & Whisker Plots (Box
Subjects:
Grades:
Not Grade Specific
Types:
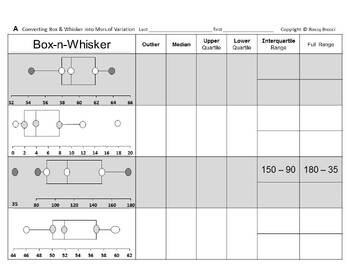
Stats&Data Slides 07: Box Whisker Plots Quartiles Interquartile Range Outliers
From the Author of Bossy BrocciMath & Big Science workbooks on Amazon,comes student fillable editable interactiveGoogle Slides™ for Google Classroom™ Students can insert/overlay text & graphics[textboxes, shapes, lines, arrows, colors etc.]onto the G-Slide image backgroundorConvert to PDF, then make it interactive onlineby using various third-party Ed. websitesorPrint it for paper worksheetsAnswer KEY included=======================Students will:1) Analyze 8 Box & Whisker Plots (Box
Subjects:
Grades:
Not Grade Specific
Types:
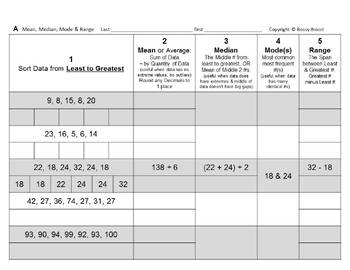
Stats&Data Slides 05: Calculate Measures Central Tendency Mean Median Mode Range
From the Author of Bossy BrocciMath & Big Science workbooks on Amazon,comes student fillable editable interactiveGoogle Slides™ for Google Classroom™ Students can insert/overlay text & graphics[textboxes, shapes, lines, arrows, colors etc.]onto the G-Slide image backgroundorConvert to PDF, then make it interactive onlineby using various third-party Ed. websitesorPrint it for paper worksheetsAnswer KEY included=======================Students will:1) Calculate Mean, Median, Mode and Range
Subjects:
Grades:
Not Grade Specific
Types:
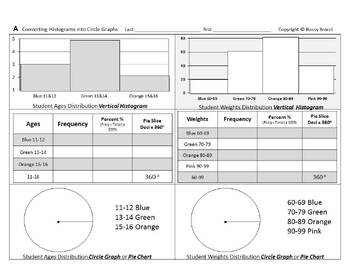
Stats&Data Slides 03: Convert Histograms into Circle Graphs Construct Pie Charts
From the Author of Bossy BrocciMath & Big Science workbooks on Amazon,comes student fillable editable interactiveGoogle Slides™ for Google Classroom™ Students can insert/overlay text & graphics[textboxes, shapes, lines, arrows, colors etc.]onto the G-Slide image backgroundorConvert to PDF, then make it interactive onlineby using various third-party Ed. websitesorPrint it for paper worksheetsAnswer KEY included=======================Students will:1) Convert 3 Vertical Histograms into3 Da
Subjects:
Grades:
Not Grade Specific
Types:
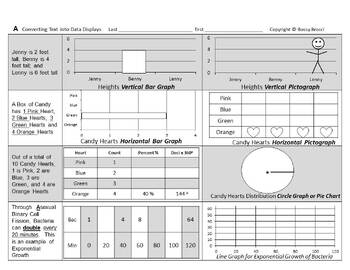
Stats&Data Slides 02: Convert Text & Create Construct Ten Types of Data Displays
From the Author of Bossy BrocciMath & Big Science workbooks on Amazon,comes student fillable editable interactiveGoogle Slides™ for Google Classroom™ Students can insert/overlay text & graphics[textboxes, shapes, lines, arrows, colors etc.]onto the G-Slide image backgroundorConvert to PDF, then make it interactive onlineby using various third-party Ed. websitesorPrint it for paper worksheetsAnswer KEY included=======================Students will:1) Read 8 Word Problems and Convert text
Subjects:
Grades:
Not Grade Specific
Types:
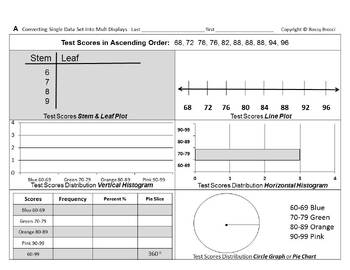
Stats&Data Slides 04: Convert Data Sets Create Construct 6 Types Data Displays
From the Author of Bossy BrocciMath & Big Science workbooks on Amazon,comes student fillable editable interactiveGoogle Slides™ for Google Classroom™ Students can insert/overlay text & graphics[textboxes, shapes, lines, arrows, colors etc.]onto the G-Slide image backgroundorConvert to PDF, then make it interactive onlineby using various third-party Ed. websitesorPrint it for paper worksheetsAnswer KEY included=======================Students will:1) Convert 2 Different Data Sets or Sets
Subjects:
Grades:
Not Grade Specific
Types:
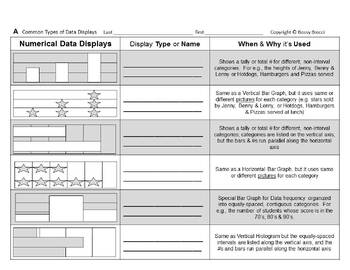
Stats&Data Slides 01: Identify & Select Common Types of Data Displays
From the Author of Bossy BrocciMath & Big Science workbooks on Amazon,comes student fillable editable interactiveGoogle Slides™ for Google Classroom™ Students can insert/overlay text & graphics[textboxes, shapes, lines, arrows, colors etc.]onto the G-Slide image backgroundorConvert to PDF, then make it interactive onlineby using various third-party Ed. websitesorPrint it for paper worksheetsAnswer KEY included=======================Students will:1) Identify and Label various Data Displa
Subjects:
Grades:
Not Grade Specific
Types:
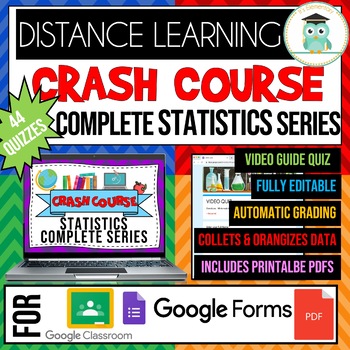
COMPLETE CRASH COURSE Statistics Series Video Quiz Google Forms Bundle
These are GOOGLE FORMS quizzes and printable PDF worksheets for 44 CRASH COURSE STATISTICS SERIES VIDEOS. Each product includes:2 Differentiated Versions of the QuizEasy Version (With a Word Bank)Harder Version (Without a Word Bank)These quizzes can be used as a video guide to hold students accountable as they watch the video. It can also be used as a video quiz to assess student learning or as part of homework. These quizzes can be assigned to your GOOGLE CLASSROOM for DISTANCE LEARNING.The GO
Subjects:
Grades:
9th - 12th, Higher Education, Adult Education
Types:
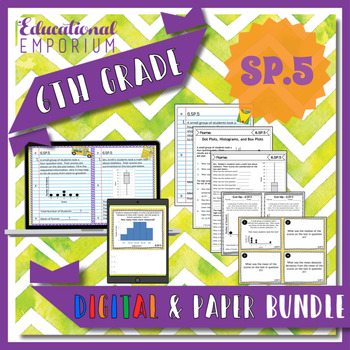
6.SP.5 Bundle ⭐ Summarize Numerical Data Sets
Summarizing a Numerical Data Set According to its Context Resource Bundle for 6th Grade Math Centers: These 10 paper and digital resources are aligned with Common Core Standard 6.SP.5: Summarize Numerical Data Sets. These Exit Slips, Task cards, Worksheets, Quizzes, and Interactive Notebooks are great for whole-class games, math centers/stations, fast finishers, extra practice, homework, scavenger hunts, quiz-quiz-trade, morning work, small groups, or review for test. All of the products come wi
Grades:
5th - 7th
Types:
Showing 1-24 of 35 results


