14 results
Graphing Common Core K.CC.A.2 microsofts
Daily Graphing Activities
My students and I LOVE graphing! Data is one of those mathematical standards that can easily be integrated into science, social studies, art, and other content areas. Graphs are also so much fun, why save them for just your data unit?
This product contains 5 graphs. You can use one graph a day, which is what I like to do, or you can use the graphs as you see fit for your students. These daily graphs are meant to be used in a shorter amount of time. They are perfect as a 5-10 minute filler eithe
Subjects:
Grades:
K - 4th
Types:
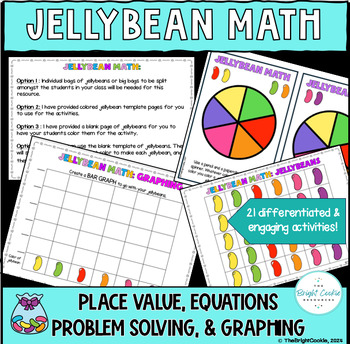
Jellybean Math: K-4th grade - Place Value, Graphing, Problem Solving, Fractions
This resource includes 31 pages and 10 differentiated and engaging activities. All the activities/pages in this resource are standards based. You can use this in spring around Easter (however, it isn’t not Easter related), or ANY time in the year in which you want to review graphing, place value, problem solving, equations/computation, and fractions. This product can be used as stations OR whole group activities. *If you would like to use real jellybeans for this activity, GO FOR IT! (We all kno
Subjects:
Grades:
K - 4th
Types:
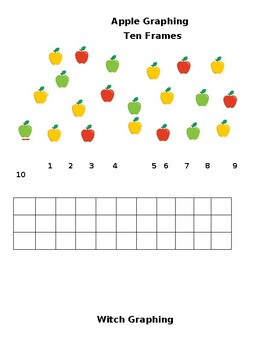
Holiday Ten Frame
This could be used as a small group or whole group activity. Students are to count how many objects there are of each picture and color that many spaces for that number.
Zoo Animals
Practice math graphing, ABCs, and sight words with this engaging zoo animal unit.
Subjects:
Grades:
PreK - 1st
Types:
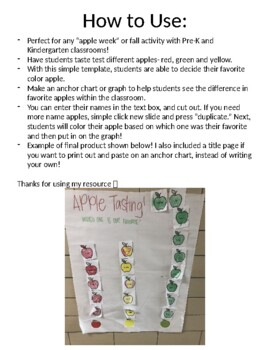
Apple Tasting Graph Template
Easy template for apple tasting graph! Put your students' names in the apples and let them decide which color apple they liked the best. Included with instructions and an example from my classroom of the finished project. Simple and easy!
Grades:
PreK - K
Types:
AAB (Animated) Pattern Tree / Tree / Turkey (Virtual editable Resource)
The PowerPoint activity is perfect for in-person or virtual instruction. This activity is used as an introduction to the AAB pattern concept. This editable resource allows students to count and quantify the correct number of A and B objects and graph their data. Two charts are presented, the students must match their data to the correct pattern photograph for accuracy. An extended activity is suggested as scholars can extend the graph on row 4 for homework.National Standards in math are identifi
Grades:
PreK - 5th
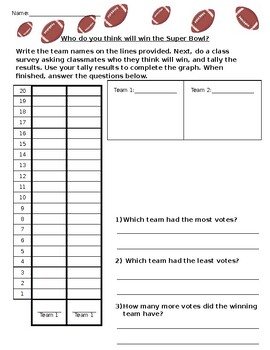
Super Bowl Survey and Graph Worksheet
Students will identify the two football teams playing in the Super Bowl. Students will ask their classmates which team they think will win the Super Bowl, and then tally the results. Students will take the tallied results to color in a graph showing their results. When finished, students will answer questions based on their results.
Subjects:
Grades:
PreK - 2nd
Types:

Reindeer Food Sort
This worksheet is for students who are being introduced to simple graphing activities. Fun to do during the winter holidays! Do this assignment as part of holiday rotations, independent work, group activity or partner work. Give students a baggie with different amounts of food. Students will sort and color how many there are of each. Students can then answer questions involving comparing and contrasting how much of each type of food there are. Students can also create simple addition and subtrac
Subjects:
Grades:
PreK - 2nd
Types:

1:1 Ice cream cones
Have your students build an ice cream cone while learning numbers! Each ice cream cone has a number on it...depending on it's number, that is how many scoops of ice cream to draw! (example: the cone says 3-the student draws three scoops of ice cream)
Grades:
PreK - 2nd
Types:
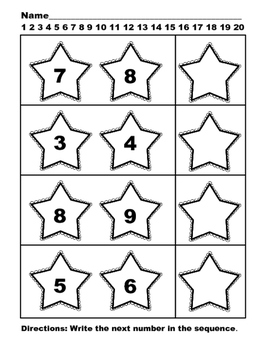
Counting Stars
Seven worksheets that include the following skills:
-Writing the next number in a sequence
-Adding to make five
-Adding to make ten
-Graphing stars by color
-Matching numerals to a set
Subjects:
Grades:
PreK - 1st
Types:
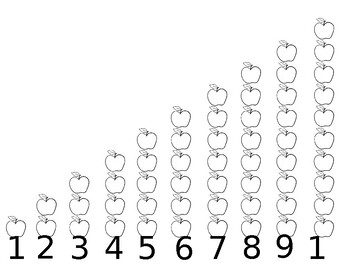
Counting Apples
You can use this worksheet in coordination with the Dr. Seuss book "10 Apples up on Top". The students can use finger paint to count the number of apples or color them in with crayon.
Grades:
PreK - K
Types:
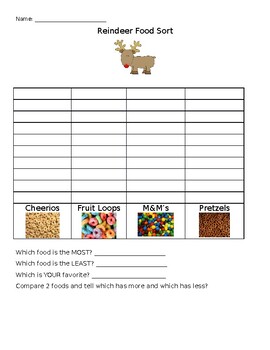
Reindeer Food Sort
This worksheet is for students who are being introduced to simple graphing activities. Fun to do during the winter holidays! Do this assignment as part of holiday rotations, independent work, group activity or partner work. Give students a baggie with different amounts of food. Students will sort and color how many there are of each. Students can then answer questions involving comparing and contrasting how much of each type of food there are. Students can also create simple addition and subtrac
Subjects:
Grades:
PreK - 2nd
Types:
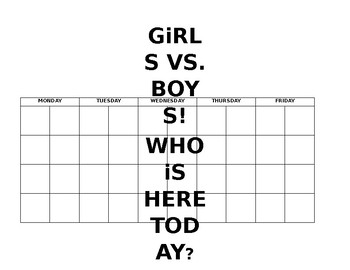
Attendance Chart: Girls vs Boys (using tally marks)
During "morning warm-up" I bring a little healthy competition into my class beginning by seeing who has better attendance, boys or girls.
After a month we count up our findings to see who earns a prize.
Not only does this work on counting with visual representation, but it brings to reality a use of graphing with tallies (and addition and or subtraction).
As the year progresses, I refer back to this chart as a model to then have the kids build their own graphs.
Subjects:
Grades:
PreK - 1st
Types:
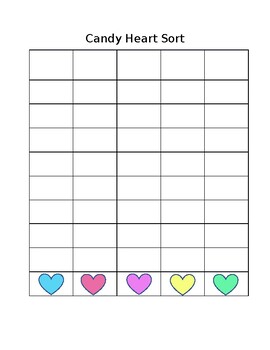
Candy Heart Graph
Students can work on sorting and counting with this pre-made graph. Sort through candy hearts and place them in the corresponding boxes, then count how many are in each column.
Grades:
PreK - K
Types:
CCSS:
Showing 1-14 of 14 results


