2 results
7th grade graphing scaffolded notes for SMART Notebook

Using Models to Represent Ratios and Rates! SmartBoard Lesson / Scaffold Notes
In this SmartBoard lesson, students will learn how number lines, charts, tables and graphs can be used to represent unit rates, rates and ratios. Students will be given examples of how ratios are placed in tables/charts to see relationships and solve for unknowns. Students will see how double number lines are also used to represent rates and ratios. Lastly, students will see how line graphs, using x and y along with points can represent ratios and rates. There are examples of each for the class
Subjects:
Grades:
5th - 7th

Perpendicular Lines Lesson
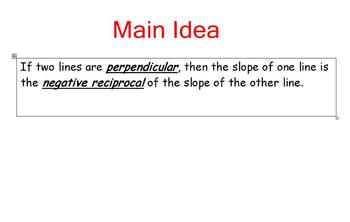
This lesson is on the how to recognize if 2 lines are perpendicular. Students will be able to recall their knowledge of negative reciprocals, use their graphing skills, and apply algebraic skills to see if 2 lines are perpendicular. There are regents based questions and critical thinking questions in the lesson.The mini-lesson has a activity sheet that is available for separate purchase.
Grades:
7th - 12th, Adult Education
Types:
Showing 1-2 of 2 results


