14 results
Statistics interactive notebooks for Easel
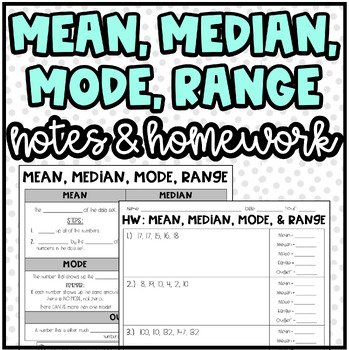
Mean, Median, Mode, Range, and Outlier | Notes and Homework or Practice
Notes & Homework: Mean, Median, Mode, Range, and Outlier:I used these notes, practice, and homework with my students. I used this lesson to serve as a "quick lesson" for the students. It covers how to find the mean, median, mode, range, and outlier.Product Includes:Notes Page with 2 examplesNotes Page Answer KeyHomework (10 organized problems with workspace provided)Homework Answer KeyThank You! ❤️I really appreciate your interest in my product! I love to create new things for my students! A
Subjects:
Grades:
5th - 8th
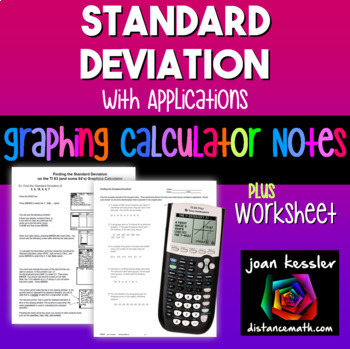
Standard Deviation on TI-84 Reference Sheets plus Practice
With this Determining the Standard Deviation on the TI 83 TI 84 Graphing Calculator plus HW step by step reference sheet your students will learn to use the graphing calculator effectively in finding the standard deviation from a data set. Use as Binder Notes or printed smaller for Interactive Notebooks.What's included?Two reference/handouts for students to learn how to find the Standard Deviation for both a population and for sample. One is for the TI 83 (yes, still in use) and the other for th
Subjects:
Grades:
8th - 11th
CCSS:
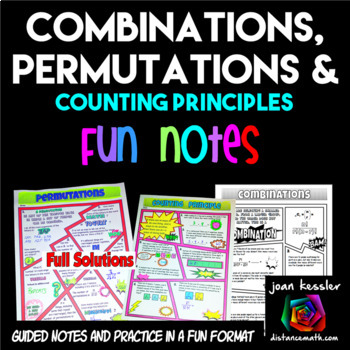
Permutations Combinations and Counting Principle FUN Notes Doodle Pages
Your students will love this Permutations, Combinations, and Counting Principle Fun Notes and Practice resource. Use it in class or as homework, assessment, or enrichment. A fun and engaging format for your students to learn the rules and practice their skills! Great for Algebra and Statistics.This resource contains 3 pages, one each for Permutations, Combinations, and the Fundamental Counting Principle. Students will complete a definitions and formula sections and complete over 20 problems.
Subjects:
Grades:
10th - 12th
CCSS:
Also included in: Algebra 2 FUN Notes Doodle Pages and Practice Bundle
Displaying Data notes Histogram Box Plot Dot Plot Stem and leaf plot
Guided notes for descriptive statistics and displaying data includes bar graph, histograms, dot plots, box plots (aka box and whisker plot), and stem-and-leaf plots. This is Unit 1: lesson 3 in the AP Statistics Curriculum.Included in this resource:Interactive notebook pages graphic organizersGuided notes Practice ("try it") pages for individual or partner work NotesAnswer keyTopics included:Construct and analyze a bar graphConstruct and analyze a histogramBar graph vs histogramConstruct and an
Subjects:
Grades:
9th - 12th
CCSS:
Also included in: Descriptive Statistics AP Statistics
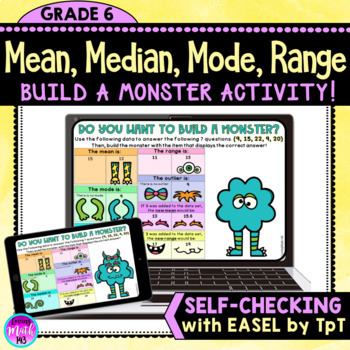
Mean Median Mode Range Build a Monster Digital Activity (Self-Checking)
This fun and engaging Digital Math Activity allows 6th grade math students to calculate the measures of center (mean, median, mode, range) for a data set in a fun and interactive way. Middle school math students will apply their understanding of probability and statistics for 7 problems! Students will use the item related with the correct answer to build a monster!★ NEW BONUS FEATURE ★This product is also available on Easel by TpT! This means, students can "Drag and Drop" their answers for a sel
Subjects:
Grades:
6th - 7th
CCSS:
Also included in: 6th Grade Math Build a Monster Self-Checking Activities {BUNDLE}
Measures of Central Tendency Notes Mean Median Mode IQR AP Statistics
Guided notes for measures of central tendency including mean, median, mode, range and interquartile range. Standard deviation and variance are addressed in a separate lesson. This is Unit 1 lesson 2 in the AP Statistics curriculum:Included in this resource:2 options for notes:Interactive notebook pages (small)Guided notes (large)Card matching activity for mean, median and modeNotesAnswer keyTopics included:MeanMedianModeRangeInterquartile rangeThis resource can be found in the following bundle
Subjects:
Grades:
9th - 12th
CCSS:
Also included in: Descriptive Statistics AP Statistics
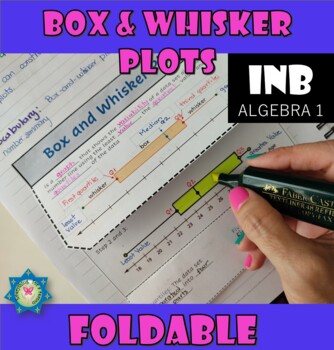
Box and Whisker Plots Foldable PDF+ EASEL
Are you looking for an activity to teach Box and Whisker Plots? This foldable/Graphic organizer will help you to teach students how to construct and interpret box-and-whisker plots. Perfect addition for your Math journals and suitable for grades 7th and 8th.Includes:- Definitions for Box-and-whisker plot, Quartiles, Five-number summary, and The Interquartile Range (IQR).- Easy steps and practical examples.This math resource can be used with Easel by TPT, Google Classroom for distance learning, h
Subjects:
Grades:
8th - 10th
CCSS:
Also included in: 8th Grade Math Interactive Notebook All-Year Curriculum PDF + EASEL
Probability Notes Statistics
Guided notes for probability. This is Unit 3: lesson 1 in the AP Statistics Curriculum.Included in this resource:Interactive notebook pages Guided notesNotesPractice problemsAnswer keyTopics included:What is probabilityAddition rule 1Addition rule 2Subtraction ruleMultiplication rule 1Multiplication rule 2This resource can be found in the following bundles:AP Statistics CurriculumAP Statistics Unit 3AP Statistics Unit 3 Notes OnlyFind the probability notes that fit your needs:Introduction to pro
Subjects:
Grades:
9th - 12th
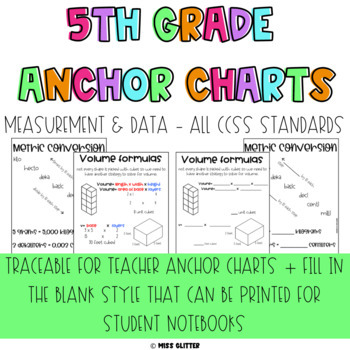
5th Grade Measurement and Data
Looking for traceable anchor charts for 5th grade measurement and data standards? This bundle has more than just math posters, it even includes student note pages to build note-taking skills in elementary.3 Versions of 5th Grade Measurement and Data ChartsBlack and White- ready to trace from your projectorColorful- ready to print at 200% for large posters to hang as referenceMath Interactive Notebook Style- scaffolded notes to print and glue into notebooksMath Poster Topics Included:making line
Subjects:
Grades:
5th
Also included in: Math Lessons for 5th Graders
6th Grade Ratio and Proportions Interactive Notebook Aides/Foldables: 6.RP.1-3
This product is related to Ratio and Proportional Relationships and contains supplementary “How-To” aides/helps/hints and/or foldables that students can glue in their interactive math notebooks. Tpt Digital Activities Pages now available!My students tell me they use their Interactive Math Notebooks for years as a reference and reminder tool!PLEASE NOTE: If you have purchased my Practice Sheet products for the 6.RP.1-3 standards, these aides and foldables are in each product as is applicable to
Subjects:
Grades:
5th - 7th
Also included in: Ratio Bundle: 6.RP.1-3

Statistics Notes
Use these notes to teach your students the following concepts:Statistical QuestionsMeanMedianMode RangeBox PlotsFrequency Tables & HistogramsUse Frequency Tables to Solve ProblemsUse Histograms to Solve ProblemsInterquartile RangeChoose Appropriate MeasuresSummarize Data Distribution
Subjects:
Grades:
5th - 7th
Also included in: 6th Grade Math Notes Bundle
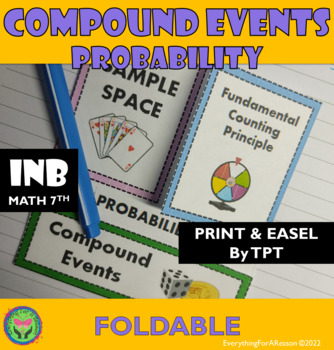
Compound Events - Probability PDF +EASEL
Are you looking for a fun and engaging resource to teach compound events in probability? if so, here is a colorful, easy, and fun foldable/ graphic organizer to help your students to learn vocabulary. It includes a practical example to clarify the ideas. This interactive foldable is perfect for your math journals or interactive notebooks. Suitable for Pre-algebra or Algebra students, grade 7th, 8th, and homeschooling.This math resource can be used with Easel by TPT, Google Classroom for distance
Subjects:
Grades:
7th - 8th
Also included in: PROBABILITY Unit - Interactive Foldables PDF + EASEL
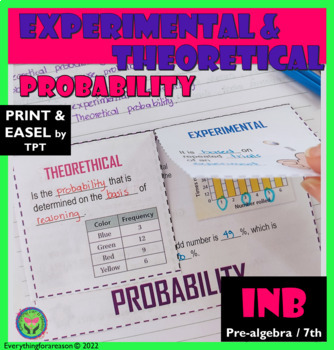
Experimental and Theoretical Probability PDF + EASEL
Are you looking for a fun and engaging resource to teach Experimental and Theoretical Probability? if so, here is a colorful, easy, and fun foldable/ graphic organizer to help your students to learn vocabulary. It includes a practical example to clarify the ideas. This interactive foldable is perfect for your math journals or interactive notebooks. Suitable for Pre-algebra or Algebra students, grade 7th, 8th, and homeschooling.This math resource can be used with Easel by TPT, Google Classroom fo
Subjects:
Grades:
7th - 8th
CCSS:
Also included in: PROBABILITY Unit - Interactive Foldables PDF + EASEL
Pie Chart Notes Descriptive statistics AP Statistics
Guided notes for pie charts. This is Unit 1: lesson 3a in the AP Statistics Curriculum.Included in this resource:Interactive notebook pages Guided notesPractice ("try it") pages for individual or partner workNotesAnswer keyTopics included:Construct a pie chartInterpret a pie chartThis resource can be found in the following bundles:AP Statistics CurriculumAP Statistics Unit 1AP Statistics Unit 1 Notes OnlyGet students ready for the AP Statistics exam with the full curriculum. Questions? Leave y
Subjects:
Grades:
9th - 12th
CCSS:
Also included in: Descriptive Statistics AP Statistics
Showing 1-14 of 14 results


