6 results
Graphing Common Core RST.6-8.1 homework
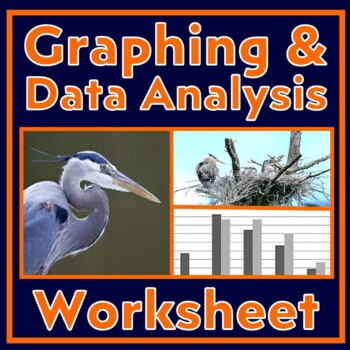
Data Analysis and Graphing Worksheet Scientific Method Practice (Herons)
Students build GRAPHING and DATA ANALYSIS skills. This activity provides a data table and an incomplete bar graph related to nesting habits of herons. Students follow directions that lead them through foundational graphing and data analysis skills. Instruction is built into the worksheet. This activity builds the following skills:Setting up bar graphs, including choosing intervals, labeling axes, and writing graph titles.Using data to make a bar graph (with an example already in place).Pulling
Subjects:
Grades:
6th - 9th
CCSS:
NGSS:
MS-LS2-2
, MS-LS2-1
, HS-LS2-1
, HS-LS2-2
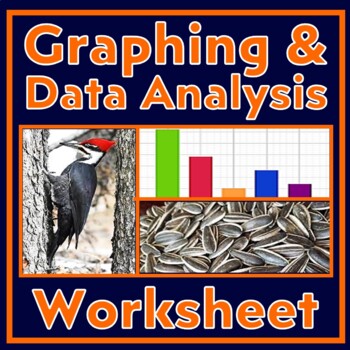
Graphing and Analyzing Data Activity with Scientific Method (Woodpeckers)
Use this data analysis and graphing worksheet to build GRAPHING and DATA ANALYSIS skills. This worksheet provides a data table from an experiment designed to find out which food woodpeckers prefer. Students follow directions that lead them through foundational graphing and data analysis skills, including making a bar graph and then analyzing it. Instruction is built into the worksheet. Students will practice the following skills in this activity:Setting up bar graphs, including choosing inter
Subjects:
Grades:
7th - 10th
CCSS:
NGSS:
MS-LS2-2
, MS-LS2-4
, HS-LS2-2
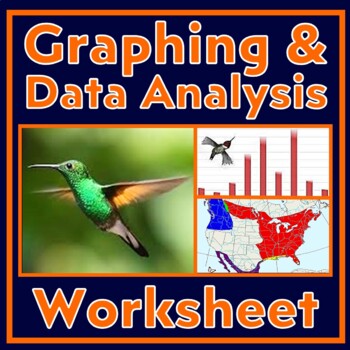
Scientific Method Worksheet Graphing and Analyzing Data Activity (Hummingbirds)
Build GRAPHING and DATA ANALYSIS skills! This worksheet provides a data table related to hummingbird migration. Students follow directions that lead them through graphing the data and analyzing it. Students will practice the following skills in this activity:Setting up bar graphs, including choosing intervals, labeling axes, and writing graph titles.Generating a bar graph from provided data.Pulling data from their graph.Data analysis that requires using data as evidence to support conclusions.R
Grades:
7th - 10th
CCSS:
NGSS:
MS-LS2-4
, MS-LS2-1
, HS-LS2-1
, HS-LS2-2
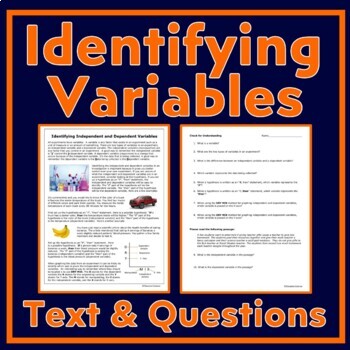
Scientific Method Independent and Dependent Variables Worksheet and Text
Middle school students learn the difference between independent and dependent variables in scientific experiments.This article and questions is also included in our Introduction to Variables Activity.In this activity, students will:Read an article explaining the difference between independent and dependent variablesAnswer basic follow-up check for understanding questions.Teacher Notes:Please note that this resource is not editable.Answer key included.Please consider clicking HERE to follow Eleva
Subjects:
Grades:
6th - 8th
Types:
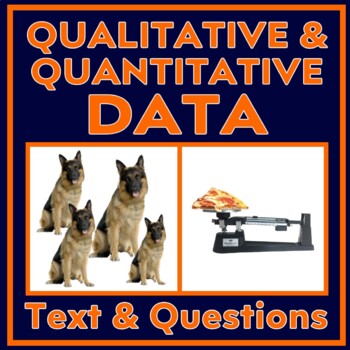
Qualitative and Quantitative Data Informational Text and Worksheet Questions
Middle school students learn the difference between qualitative and qualitative in scientific experiments.This article and questions is also included in our Introductory Data Analysis Activity.In this activity, students will:Read an article explaining the difference between qualitative and quantitative data.Answer basic follow-up check for understanding questions.Teacher Notes:Please note that this resource is not editable.Answer key included.Please consider clicking HERE to follow Elevation Sci
Subjects:
Grades:
6th - 8th
Types:
Argumentative Writing Prompt – Diseases in the Mid-1900s
This is a lesson that combines the basics of argumentative writing (claim-evidence-reasoning) as well as germ theory and the proliferation of vaccines in the 1950s.This lesson is all-encompassing; meaning the student should be able to complete the lesson without referring to outside resources. This could easily be modified to include a more robust research lesson on the spread of disease in America in the 1900s and the increased use of vaccines at the same time.I use this as a digital break for
Showing 1-6 of 6 results


