36 results
6th grade Common Core 7.SP.B.4 graphic organizers
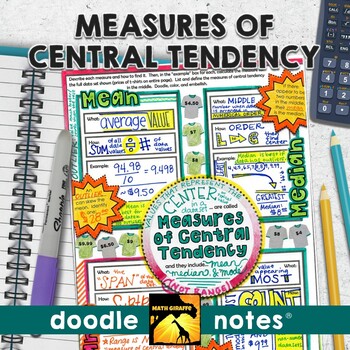
Measures of Central Tendency Doodle Notes (Mean, Median, Mode, & Range)
Mean, Median, Mode, and Range (Measures of Central Tendency): "doodle notes" - visual note taking pages with interactive tasks for building stronger retention of measures of center (mean, median, mode, and range) for your middle school statistics unit in Pre-AlgebraBoost your students' focus and memory! The blend of graphic and linguistic input in these guided visual notes helps students' brains to convert the information to long-term memory more easily.When students color or doodle in math clas
Subjects:
Grades:
6th - 8th
Middle School Math Interactive Notebook Bundle - 6th 7th 8th TEKS CCSS
This MEGA Bundle contains lessons for an Interactive Notebook for 6th, 7th and 8th Grade Math. This Ultimate Bundle not only provides the Flippables (foldable activities) but also items necessary to complete your Interactive Notebook (INB) lessons as well as an online photo gallery for each of the grade levels sorted by unit.Includes:► 6th Grade INB Unit for The Number System► 6th Grade INB Unit for Ratios and Proportional Reasoning► 6th Grade INB Unit for Expressions► 6th Grade INB Unit for One
Subjects:
Grades:
6th - 8th
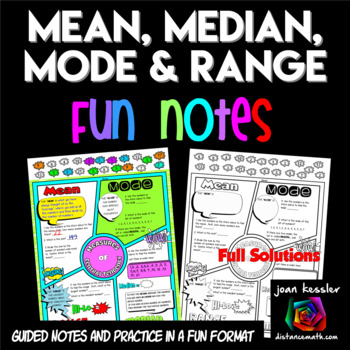
Measures of Central Tendency FUN Notes Doodle Pages
Your students will love learning the Measures of Central Tendency with these Fun Notes done in a comic book theme. Topics include Mean, Median, Mode, and Range. Students complete 6 problems plus definitions. There are two versions of the notes so you can differentiate. The PDF also includes 2 sizes, one standard 81/2 x 11" and the other in half size for INB's. Students love to doodle while learning and it has been shown that doodling and working with fun themed activities help students engage
Subjects:
Grades:
6th - 9th
Also included in: Algebra 1 FUN Notes Doodle Page Bundle
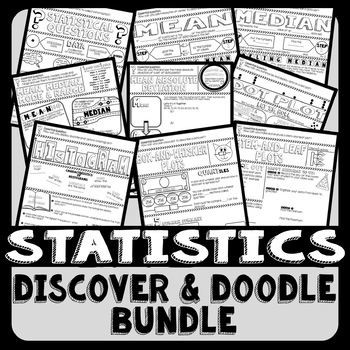
Statistics Discover & Doodle Bundle
Looking for engaging notes that maximize class time and retention? Discover & Doodle pages are research based and combine words with visuals that boost student recall of information. They help students see what is important and visualize mathematical connections. Print full size for a binder, folder or handout. Need smaller size note pages to glue into a notebook? Follow the printing directions included to scale the pages down to notebook size.Each Discover & Doodle Topic Includes⇒
Subjects:
Grades:
5th - 7th
Statistics and Probability Foldable Bundle
This product contains 6 foldables directly aligned to the 7th Grade Common Core Statistics and Probability Standards.
Each topic has a completed foldable, a fill in the blank foldable, and a pictorial for how to fold each foldable.
This bundle includes:
7.SP.1 - Characteristics of a Fair Sample
7.SP.2 - Drawing Inferences from a Sample
7.SP.3 & 7.SP.4 - Measures of Center vs. Measures of Variation
7.SP.5 & 7.SP.6 - Experimental vs. Theoretical Probability
7.SP.7 - Calculating Probab
Subjects:
Grades:
6th - 8th
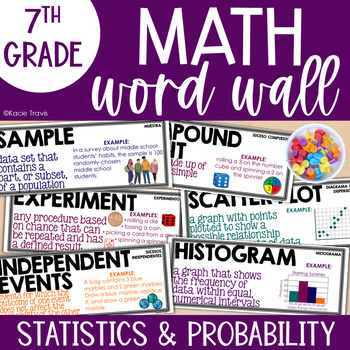
Statistics & Probability Word Wall & Graphic Organizer 7th Grade Math
One of the most challenging parts of teaching math is all the vocabulary. Set your 7th grade math students up for success by giving them lots of scaffolding and opportunities to learn all of the new terms. This resource supports the Statistics and Probability strand of 7th-grade math. This word wall and graphic organizer are designed to help students learn 31 related vocabulary terms. Included in this resource:3 versions of decorative words for a word wall (laminate and save for years)
Grades:
6th - 8th
Also included in: Math Word Wall 7th Grade Math BUNDLE
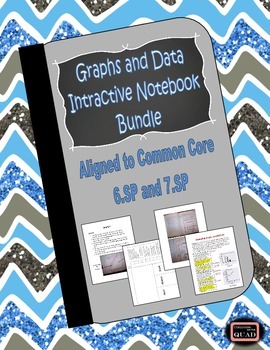
Graphs and Data Interactive Notebook Lessons {6.SP and 7.SP}
Looking for step by step instructions for interactive notebooking using data and graphs? This file is exactly what you need! There are complete instructions for notebook organization and how students use a self assessment stop light graphic organizer to communicate their comprehension of the lesson. For each lesson, there are complete instructions, student foldables to make the entries completely interactive, and pictures of sample pages. Each lesson also contains data to use with the foldables.
Subjects:
Grades:
4th - 7th
Guided Notes: Entire Year Bundle
This is a Bundle of Seventh Grade Guided Notes! Save money by purchasing this bundle which includes twenty units of math resources for 30% off what you would pay by buying them separately!This set includes guided notes for the entire 7th-grade math curriculum, aligned with the Common Core State Standards.These resources were put together using Canva. You will get the guided notes in PDF format.Each item is intended to be printed as followed:Guided NotesPrint the guided notes from the PDF on 8.5
Subjects:
Grades:
6th - 8th
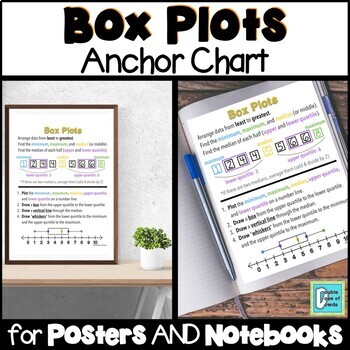
Box Plots Anchor Chart for Interactive Notebooks and Posters
This anchor chart for box plots will help your students solve box plot problems. We prefer to keep anchor charts simple and neat so as not to overwhelm our students and to keep them focused on essential information. This is a one-page anchor chart that comes in a variety of formats including a single sheet, half sheets (great for interactive notebooks), and a 2x2 POSTER. The poster will print on 4 sheets of paper which you will need to trim and tape to form one large poster.If you like this anc
Subjects:
Grades:
6th - 9th
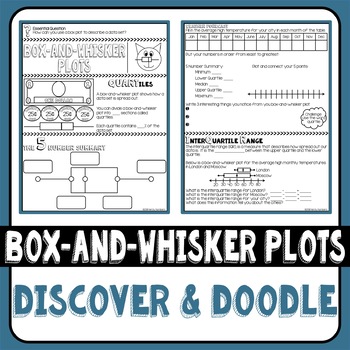
Box-and-Whisker Plot Discover & Doodle
Looking for engaging notes that maximize class time and retention? Discover & Doodle pages are research based and combine words with visuals that boost student recall of information. They help students see what is important and visualize mathematical connections. Print full size for a binder, folder or handout. Need smaller size note pages to glue into a notebook? Follow the printing directions included to scale the pages down to notebook size.Discover & Doodle Pages Include⇒ Printi
Subjects:
Grades:
6th - 7th
Also included in: Statistics Discover & Doodle Bundle
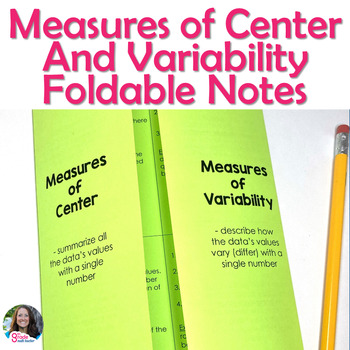
Measures of Center and Measures of Variability Foldable Notes for INB
These foldable notes are a great way for students to learn about measures of center and measures of variability (and when to use which one). The foldable includes step-by-step directions and examples for each concept. It is also aligned with the Common Core State Standards (CCSS).Students are often unsure when to use mean and when to use median to best describe the distribution of data. This foldable not only explains how to find these measures, but also reminds them when to use each one.Inside,
Subjects:
Grades:
6th - 7th
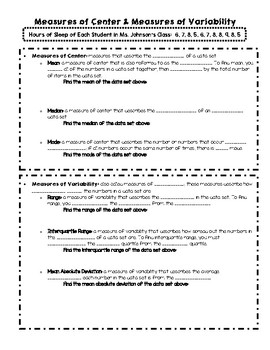
Measures of Center & Variability Guided Notes
These notes walk students through the definitions of the measures of center (mean, median, mode) and measures of spread (range, interquartile range, and mean absolute deviation). As students learn each definition, they also find the measures for a given set of data.
Subjects:
Grades:
6th - 7th
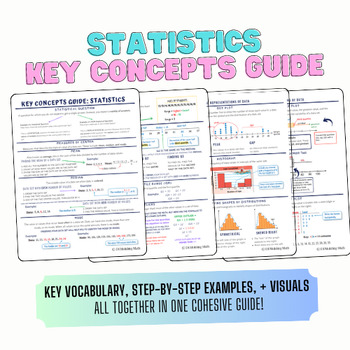
Statistics: Key Concepts Guide
This guide includes info on statistical questions, mean, median, mode, range, quartiles, interquartile range, outliers, dot plots, box-and-whisker plots, stem-and-leaf plots, shape distribution, and histograms!Give students the KEY to success with this cohesive four-page key concepts guide for your statistics unit!As a teacher, I know the struggles of making sure students come prepared with their notes or take notes that are legible and usable. After creating this resource I have seen huge incre
Subjects:
Grades:
5th - 8th
Also included in: 6th Grade Math: Key Concepts Guides/Anchor Charts BUNDLE
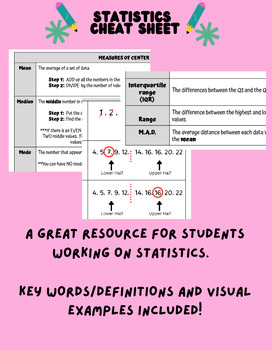
Statistics Cheat Sheet
A great reference sheet for students working on statistics (measures of center & measures of variation).This includes key terms: mean, median, mode, quartiles, interquartile range (IQR), range, and mean absolute deviation (MAD).Print it out and hand it out to students at the beginning of the unit or enlarge it and make it poster size for the classroom!Check out my "Middle School Math Resource Packet" for 22 different reference sheets (including this product) for students to use during the en
Subjects:
Grades:
5th - 8th
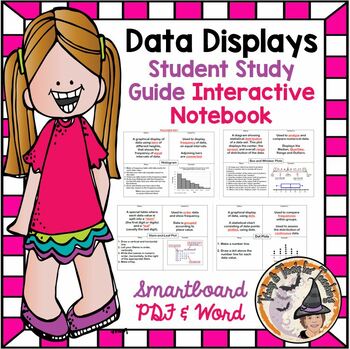
Data Displays Interactive Notes Stem Leaf Box Whiskers Histogram Dot Plots
Teachers ~ You'll LOVE these Interactive Notes that covers the following 4 data displays; Stem and Leaf Plot, Box and Whisker Plot, Histogram, and Dot Plot. The zipfile contains the Teacher's KEY version along with the Student's Fill in the Blank outline for Note Taking. You get BOTH the Students' Notes and the Teacher's KEY in both Word and Pdf formats for easy printing, along with Smartboard slides of everything as well. You'll LOVE using this year after year! Be sure to L@@K at my other 1,285
Subjects:
Grades:
5th - 7th, Staff
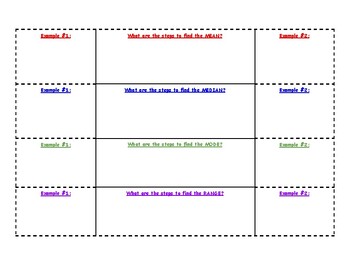
Math Foldable - Mean, Median, Mode, and Range
Use this scaffold to support learning instruction. Students can research the measures of center/spread and find examples that model the measure. Dotted lines are for cutting help differentiate for students who need OT support. PLEASE NOTE! When printing, you must print double sided on the SHORT EDGE
Subjects:
Grades:
6th - 7th
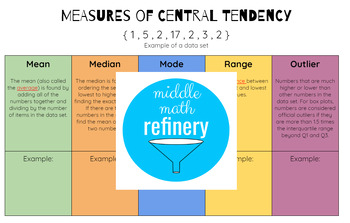
Measures of Central Tendency (Mean, Median, Mode, Range, Outlier)
This user-friendly resource is a great reference sheet for students learning about measures of center (mean, median, mode, range and outliers). Having tools like this to reference while working helps students to remember concepts and encourages self-reliance and ownership of own's learning. This resource works well in a graphic organizer and also word walls.Included: black and white printablecolor printableblack and white printable with answer keycolor printable with answer key
Subjects:
Grades:
6th - 10th
Math Foldable - Mean, Median, Mode
Use this scaffold to support learning instruction. Students can research the measures of center and find examples that model the measure. Dotted lines are for cutting help differentiate for students who need OT support. PLEASE NOTE! When printing, you must print double sided on the SHORT EDGE
Subjects:
Grades:
6th - 7th
(BUNDLE) 7th grade CCSS math intervention notes & practice (24 practice pages!)
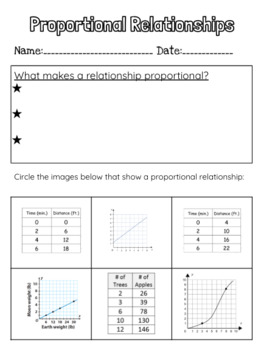
I use these weekly with my sped math intervention group! They keep them in their folder and pull them out during class to use as notes and examples. Enjoy!covers the following 7th grade topics:graphingproportional relationshipsconverting fractions/decimals/percentsrepeating and terminating decimalsinteger operationsorder of operationsalgebra tilescombining like terms distributive propertysolving equationssolving & graphing inequalitiesscale factorsimilar figuresdouble number linessolving pro
Subjects:
Grades:
6th - 8th
Mean, Median, Mode, Range Foldable
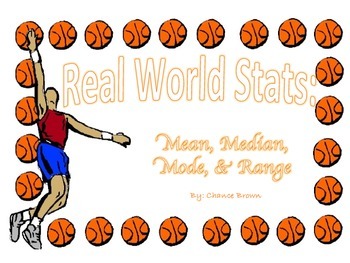
Use this foldable to introduce or assess mastery of mean, median, mode, and range that incorporates real-world basketball statistics of points scored in one game by the San Antonio Spurs' starting five players. Glue or staple into interactive journals or notebooks to reference as students continue to work with mean, median, mode, and range, or post inside or outside of the room as student work samples!
Print the second page on the backside of the first. Fold so that "Mean," "Median," "Mode," a
Subjects:
Grades:
5th - 8th
M.A.D Reference Sheet | Mean Absolute Deviation Graphic Organizer | Statistics
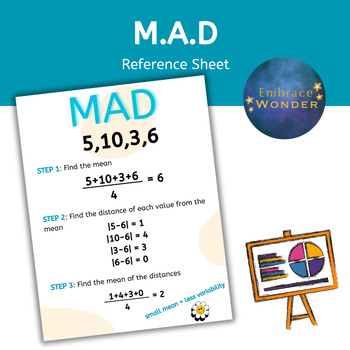
Teaching M.A.D? Is your classroom filled with the joy of students analyzing data and crunching numbers? Add this Mean Absolute Deviation Reference Sheet to your lesson collection. Also great for students in an IEP that require a graphic organizer in their lessons. Easy to print and project!What's included:1 PDF• Images are high resolution PDFs, perfect for printing and web use.---------------------------------------------------------------------------------------------------------------Let's Con
Subjects:
Grades:
5th - 12th, Higher Education, Adult Education, Staff
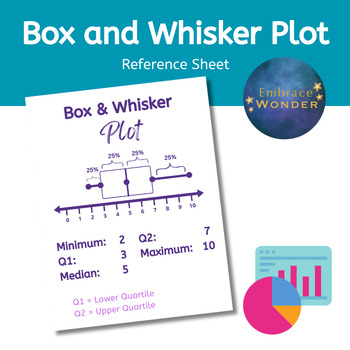
Box and Whisker Plot Reference Sheet | Graphic Organizer | Students on IEP
Teaching Statistics? Is your classroom filled with the joy of students analyzing data and crunching numbers? Add this Box and Whisker Plot Reference Sheet to your lesson collection. Also great for students in an IEP that require a graphic organizer in their lessons. Easy to print and project!What's included:1 PDF• Images are high resolution PDFs, perfect for printing and web use.---------------------------------------------------------------------------------------------------------------Let's C
Subjects:
Grades:
5th - 12th, Higher Education, Adult Education, Staff
CCSS:
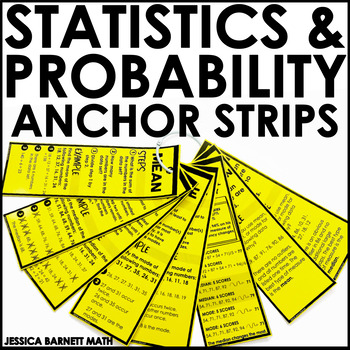
7th Grade Math Statistics and Probability Unit Anchor Strips
This resource includes 26 strips designed to use when teaching a unit on statistics and probability in 7th grade math. Great for summer school or June and July at home review!Each strip includes steps to solve and an example. They are great for enhancing classroom instruction, aiding in individual or group assignments, and offering a "go-to" for students when the teacher is assisting others.Print options include 4 different strips per page OR the same anchor strip 4 times on a page.★RECOMMENDATI
Subjects:
Grades:
6th - 8th
Also included in: 7th Grade Math Curriculum Mega Bundle Worksheets Activities Homework
Measures of Variance Foldable (range, IQR, MAD)
This foldable has 3 tabs, each with explanations and completed examples for the three measure of variance: range, IQR, MAD
Subjects:
Grades:
6th - 9th
CCSS:
Showing 1-24 of 36 results


