2 results
Higher education government resources for Microsoft Excel $5-10
Graphs, Charts, and Tables: U.S. Census Data Study
This lesson uses data from the 2010 U.S. Census to allow students to access numbers and data in a social science classroom. The lesson is a 2 day mini-unit centered on working with charts, graphs, and tables (serves extremely well for SAT and ACT prep). This cross-curricular lesson draws meaningful parallels between math and social science, and the necessity of bringing these subjects together. The lesson uses a comparative look at Census data for California and the United States as a whole, but
Subjects:
Grades:
8th - 12th, Higher Education
Types:
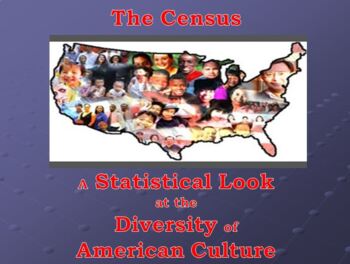
The Census - A Statistical Look at the Diversity of American Culture.
A Statistical Look at the Diversity of American Culture. Whether, it is used with a class or any group, the purpose is to open the eyes of the participants to how diverse our population really is. Preview presentation has notes to explain what the Census is and how to use the Spreadsheet. The spreadsheet sums up the results of data collected and automatically displays on both the Bar Graphs and the Pie Charts. Spreadsheet is compact and uncomplicated. It allows for easy to understand results
Subjects:
Grades:
7th - 12th, Higher Education, Adult Education
Types:
Showing 1-2 of 2 results

