2 results
5th grade Valentine's Day Common Core 7.SP.B.4 resources

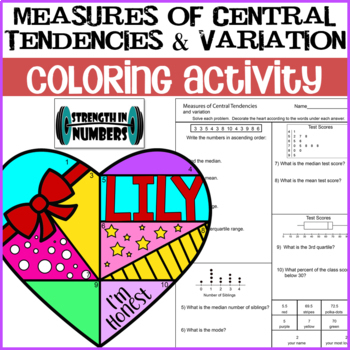
Measures of Central Tendencies & Variation Valentine's Day Coloring Activity
Students will answer 10 data questions including mean, median, mode, range, quartiles, and interquartile range using lists, dot plots, box plots, and stem-and-leaf plots. This worksheet is self checking - answers are at the bottom and students will use the description under the answer to decorate the heart. All my favorite things - colorful, self-checking, and wall-worthy! These are fantastic hung around the classroom for Valentines Day (or anytime your classroom needs a little LOVE) because
Subjects:
Grades:
5th - 8th
Types:
CCSS:

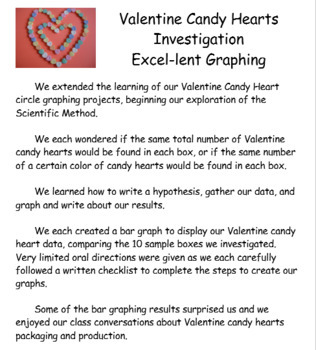
Excel Graphing Valentine Candy Hearts Investigation
#welovecandyheartsThis integrated Math/ Science/ Technology project is a great way to make statistics and probability real, relevant, fun, and delicious!Students will create bar graphs using Excel to display Valentine candy hearts data, as students consider packaging and production of small Valentine candy heart individual boxes. Project file includes sample bulletin board display poster, project directions in individual student checklist form, and rubric to grade the finished graph.Project file
Grades:
5th - 7th
Types:
NGSS:
3-5-ETS1-2
, MS-ETS1-3
Showing 1-2 of 2 results


