2 results
Earth Day visual arts Common Core 7.SP.B.4 resources

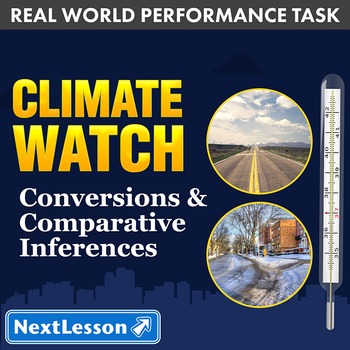
Performance Task - Conversions & Comparative Inferences - Climate Watch: AK & WA
Performance Task – Conversions & Comparative Inferences - Climate Watch: Alaska & Washington. Perfect for Earth Day!
In the Climate Watch Performance Task, students convert extreme temperatures from Celsius to Fahrenheit for accurate comparisons of climate between regions. As climate scientists, they practice working with measures of center and variation to determine if climate change can be proven.
What’s included in this Performance Task:
* Teacher Guide – Get an overview of the Per
Subjects:
Grades:
7th
Types:

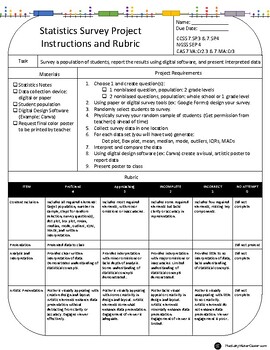
Statistics Survey Project
Facilitate school connectedness, visual art and 7th grade statistics with this end of unit survey project. I utilize this project in lieu of a final test. Students generate questions of interest, decide on their target student population and physically collect data. With this data, students design posters using digital art software and publicly present their real life findings.
Subjects:
Grades:
7th
Types:
NGSS:
MS-ETS1-3
Showing 1-2 of 2 results


