52 results
High school algebra 2 laboratory pdfs under $5
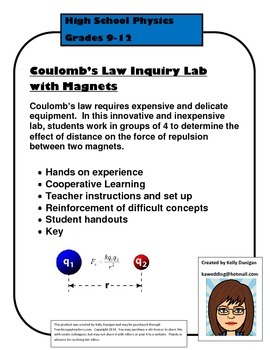
Coulomb's Law Inquiry Lab with Magnets
Coulomb's law requires expensive and delicate equipment. This chape and easy version is a clever and innovative inquiry lab that is appropriate for on-level, pre-AP, honors, and AP physics.
Students work in groups of 4 to determine the effect of distance on the repulsive force between two similar magnets. Disk magnets are best, neodymium disk magnets even better, but any small magnets will work.
Student express surprise at feeling the force of repulsion between the magnets. This is measured
Subjects:
Grades:
9th - 12th, Higher Education
Types:

Inverse Function Investigation with Desmos.com
In this online investigation, students use Desmos.com as a substitute for the traditional graphing calculator to investigate properties of inverse functions. This is a great introductory activity into inverse functions as it gives students a visual understanding of what a function and its inverse can look like. In the activity, students are instructed to create a table of values for a function, create the table of values for the inverse function, and graph the line y=x. In so doing, students
Subjects:
Grades:
8th - 9th
Types:
CCSS:
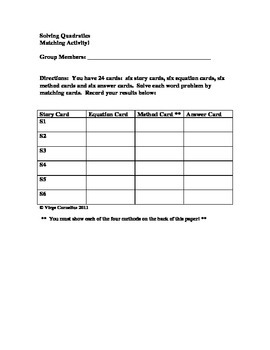
Matching Activity - Solving Quadratics
Three things come to mind as to why I wrote this activity...
First, students are petrified of word problems. I wrote this activity to give students experience with solving applications of the quadratic. Second, I want students to demonstrate their ability to use four different methods to solve quadratics. Third, I want students to be cognizant that they will need to decide which method is best given the structure of the quadratic equation.
There are 24 cards: 4 story cards, 4 equation car
Subjects:
Grades:
8th - 10th
Types:
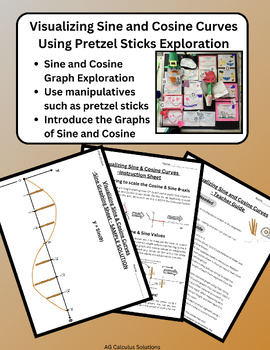
Introduction to Visualizing & Graphing Sine & Cosine Using Pretzels Exploration
Help students make connections while introducing the graphs of sine and cosine using mini pretzel sticks or equivalent manipulatives. Within this lesson, students will be able to interact with both the sine and cosine graphs using manipulatives such as string and pretzel sticks as they form a tactile graph in groups or individually. A thorough instruction sheet is provided to ensure all students are equipped to create their own pretzel graph. You can also substitute spaghetti, straws toothpicks
Subjects:
Grades:
10th - 12th
Types:
Quadratic Functions - Introduction to graphing with Technology
I introduce my students to graphing quadratic functions using technology with this self made worksheet. My students like spending time in the computer lab, it gives them independence to try something new and they enjoy seeing the graphs be formed on the screen as soon as they type in an equation and they love getting out of the classroom! It is a lot more fun then graphing with paper and pencil.
I consider this work as a project because it is work done outside a classroom. It requires a com
Subjects:
Grades:
7th - 11th
Types:
CCSS:

Webquest Investigation - Slope of a Line
Using a free online graphing calculator, students explore relationships between linear equations, their graphs, and the slopes of the lines. By the end of this investigation, students will discover relationships between parallel lines, perpendicular lines, and their slopes. Enjoy!
Subjects:
Grades:
7th - 11th, Adult Education
Types:
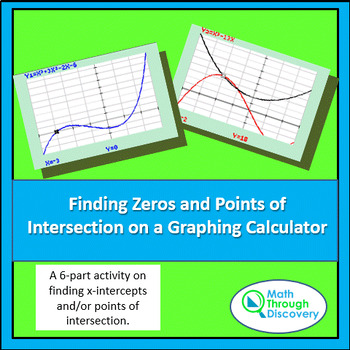
Alg 2 - Finding Zeros and Points of Intersection on a Graphing Calculator
This activity is broken into seven parts. Part I: Guides students in noticing that the trace key may not locate the x-intercepts (zeros) but shows them that there is another way x-intercepts can be found. Part II: Illustrates that there are algebraic techniques that can be incorporated in finding zeros.Part III: Shows student show to use a built-in feature to find x-intercepts or zeros.Part IV: Investigates how tables can be used to find x-intercepts and/or points of intersection. Part V: Chall
Subjects:
Grades:
10th - 12th
Types:

Trigonometric Functions on the Graphing Calculator - An Exploration
This activity sheet engages students in studying the general trigonometric equation y = a + b cos(cx) and making statements about the period, amplitude, y-intercept, and x-intercepts. After developing ideas with the cosine function, students make conjectures about similar sine graphs and then make a prediction of how a cosine graph would be changed to produce a particular graph.
Subjects:
Grades:
10th - 12th
Types:
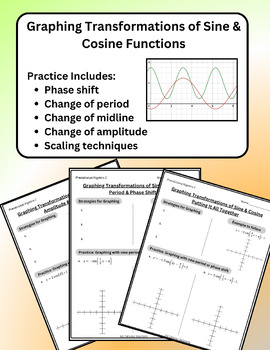
Transforming Sine & Cosine Graphs - Practice / Lesson / Worksheet
Help students learn how to graph all the transformations of the sine and cosine graphs using this interactive practice guide. The practice includes how to adjust the graph's period, amplitude, midline, phase shift and strategies for coming up with a proper scale for each tick mark on the x-axis. A comprehensive answer key is included in the packet along with some sample strategies to teach to students if needed. This lesson corresponds to AP Precalculus Sections 3-4, 3-5 and 3-6
Subjects:
Grades:
9th - 12th
Also included in: Transforming Sine, Cosine, Tangent, Secant, Cosecant, Cotangent BUNDLE
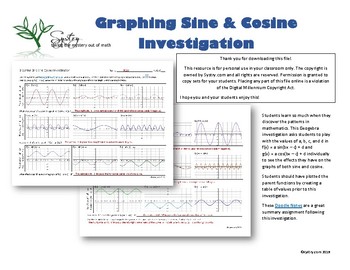
Graphing Sine & Cosine Investigation
Students learn so much when they discover the patterns in mathematics. This Geogebra investigation asks students to play with the values of a, b, c, and d in f(x) = a sin(bx – c) + d and g(x) = a cos(bx – c) + d individually to see the effects they have on the graphs of both sine and cosine.Students should have plotted the parent functions by creating a table of values prior to this investigation. These Vizual Notes are a great summary assignment following this investigation.If you are looking
Subjects:
Grades:
10th - 12th
Types:
CCSS:
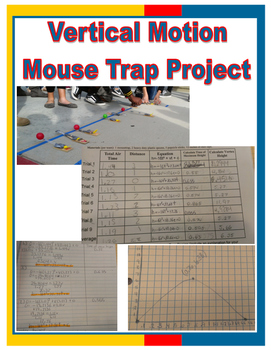
Vertical Motion Mouse Trap Project
Students will create mouse trap catapults from mouse traps, craft sticks, plastic spoons and duct tape. Students will launch ping pong balls and record initial height, time and distance for 9 trials. They will then find the average air time and average distance. Next, they will substitute in their average time (t), initial height (c), and end height (h) into the equation h=-16t² + vt + c and solve for v, for each of the 9 trials & average. Once they have their initial velocity they substitu
Subjects:
Grades:
9th - 12th
Types:
Systems of Linear Equations - Solving by Graphing with Technology
This is a project I use in my Algebra 2 Honors classroom to help my students practice graphing a system of linear equations.. The questions for each graph are as follows:
Classify the System _______________________
Solution (s) ? if yes, write solution, otherwise, write No Solution_________________________________________
Y-intercept _____________for first line
Y-intercept _____________for second line
This project takes about 1 -2 periods in the computer lab using graphing software or a gra
Subjects:
Grades:
8th - 12th
Types:
CCSS:
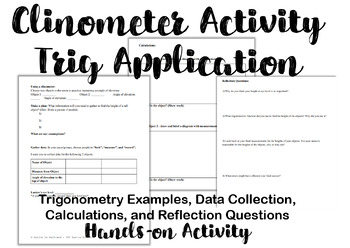
Clinometer Activity - Application of Trigonometry
This is a hands-on activity I have my students do after introducing right triangle trigonometry (SOH CAH TOA). As motivation we discuss applications of trig such as forestry! I have a set of clinometers and 15 meter measuring tapes, but students can actually make their own clinometers with string and protractors! We do the two examples together in class, and then I have student practice using the clinometers. Then, they can go outside and take measurements of trees, buildings, flag poles, etc.
Subjects:
Grades:
10th - 12th
Types:
CCSS:
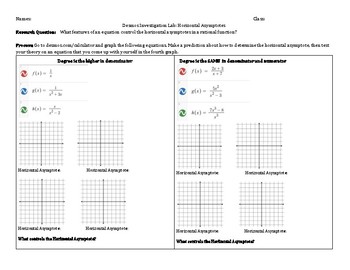
Rational Functions Asymptotes Investigation Task
Help your students discover the patterns of horizontal asymptotes in this interactive rational functions math lab!
Students explore the three "cases" for horizontal asymptotes in rational functions.Students use the desmos calculator to discover the patterns that govern horizontal asymptotes, and extend their knowledge to understand how to find slant asymptotes.
Students then practice recognizing horizontal asymptotes of rational functions by sorting them according to case ( based on the degr
Subjects:
Grades:
10th - 12th
Types:
CCSS:

Alg 1 - Modeling Exponential Growth-Decay on the Graphing Calculator
This is a graphing calculator activity that will engage the students in collecting data on both exponential growth and decay using M&Ms. The graphing calculator is used to create scatter plots and equations that represent both situations from the data collected.In part I the students, after students have collected data using the M&M’s students are guided at entering the data into their graphing calculators. Screen shots guide and assist the students in the calculator steps. When they h
Subjects:
Grades:
9th - 12th
Types:
CCSS:
Linear Equations Graphing with Technology
This is a project I use in my Algebra classroom to help my students practice graphing linear equations given in standard form using technology such as Geogebra, Desmos calculator or a graphing calculator.
The topics included are finding the following information from the different graphs:
Slope = ___________
X-intercept ________
Y-Intercept _______
Students are also required to write the slope intercept form.
A reflection is required at the end of the project in part to get some fe
Subjects:
Grades:
7th - 12th
Types:
CCSS:
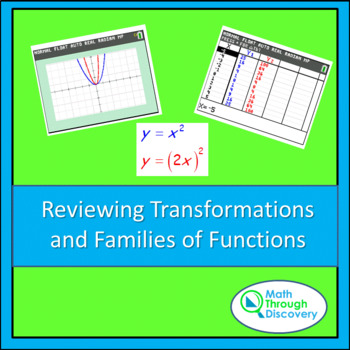
Alg 2 - Reviewing Transformations and Families of Functions
This activity engages the students in reviewing transformations on a function such as scalar multiples, vertical and horizontal shifts, and taking absolute value of domains and ranges. In the first part students • Compare the graphs and a set of table values for y=f(x) and y=f(ax). Make a statement about the effect a has on the functions.• Compare the graphs and a set of table values for y=f(x) and y=af(x). Make a statement about the effect a has on the functions.• Compare the graphs and a
Subjects:
Grades:
9th - 12th
Types:
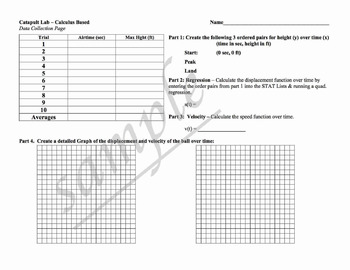
Polynomial Labs (Quadratics, Cubics, etc.) including Catapults!
This lab includes two versions of a catapult lab (calculus based and non-calculus based). Students work in groups to collect data on a ball launched using a catapult. Students create regression equations using a graphing calculator or spreadsheet.
Also included is a painted cubes lab that includes 4 types of functions.
Courses: algebra 1, algebra 2, pre-calculus, calculus
Here are links to my other algebra projects:
Click Here to see my project: Indirect Measurement Labs
Click Here to see
Subjects:
Grades:
8th - 12th, Higher Education, Adult Education
Types:

Which Cell Phone Plan Should I Use?: The Algebra Lab Manual
There are so many advertisers on TV trying to get you to buy their cell phone plans. How do you decide which cell phone plan will be more cost effective? This activity will try to help you decide the answer to this question. As you make your through this activity, it will improve your algebraic skills by reinforcing the theory of graphing data, generating equations, creating data tables, defining variables, and formulating a conclusion for each of your students. The “cell phone plan” activi
Subjects:
Grades:
8th - 11th, Adult Education
Types:
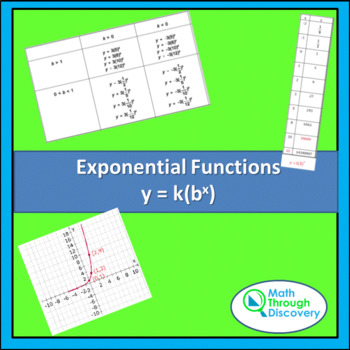
Alg 1 - Exponential Functions y = k(b^x)
Through this hands-on activity students will use the graphing calculator to study the affects of K and B on the equation y = k(b^x). Students will study exponential functions graphically and numerically.In my store there is an identical activity that uses the function y = a(b^x) rather than y=k(b^x).
Subjects:
Grades:
10th - 12th
Types:
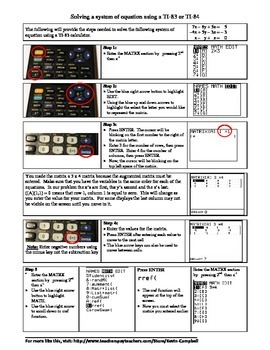
Solving Systems of Equation using a TI-83/84 & Gauss-Jordan Elimination
This handout explains how to use the reduced row echelon form (RREF) function in the TI-83/84 to solve system of equations problems. It also includes an explanation of the Gauss-Jordan Elimination Method upon which the function is based. The handout includes pictures to show the proper buttons that must be selected to properly use the function. It also includes an explanation of how to interpret the results.
Subjects:
Grades:
9th - 11th, Adult Education
Types:
Investigating Graphs Behavior Near Zero
This is a polynomial graphing investigation looking at multiplicities of zeros and what that does to the graph. You will need access to graphing calculators for your students (or you can use desmos.com) and demonstrate the four graphs on the front page. This will have the students look at four different graphs and relate the multiplicities with whether the graph crosses the x-axis or just touches the x-axis. Then as a conclusion to the investigation they will sketch a rough graph using only t
Subjects:
Grades:
9th - 12th
Types:
CCSS:
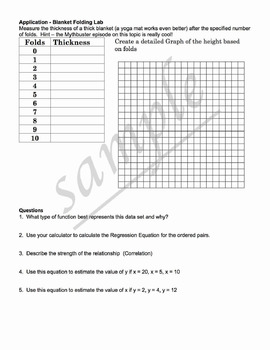
Exponential Logarithm Trigonometric Activities and Labs
This project set includes 8 projects that are cooperative learning, hands-on labs. Students collect data that fit exponential, logarithmic, or trigonometric patterns. Students will create equations from the data and use the equations to make predictions. Many of the equations students create will be through the regression process on graphing calculators or spreadsheets.
classes: algebra 2, pre-calculus, calculus, applied math
Here are links to my other algebra projects:
Click Here to see m
Subjects:
Grades:
9th - 12th, Higher Education, Adult Education
Types:
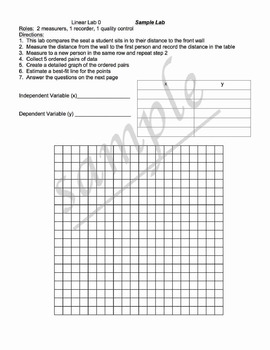
Linear Relationship Labs
This project has 1 sample lab to complete together as a class and 6 other labs that create a linear relationship.
Students work through the labs collecting data and then analyze the data to create equations, use calculators or spreadsheets to create regression equations (best fit lines), and use the equations to make predictions.
classes: algebra 1, geometry, algebra 2, applied math
Here are links to my other algebra projects:
Click Here to see my project: Systems of Equations - Comparing Ph
Subjects:
Grades:
7th - 12th, Higher Education, Adult Education
Types:
CCSS:
Showing 1-24 of 52 results


