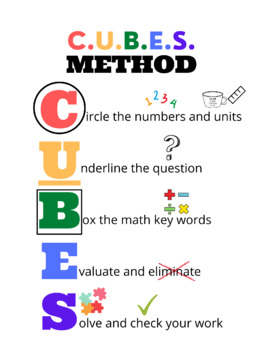
Word Problem Analysis Resource/Anchor Chart (CUBES Method) Includes Images
Talk Math To Me
2 Followers
Grade Levels
PreK - 8th
Subjects
Resource Type
Standards
CCSS2.MD.B.5
CCSS2.MD.C.8
CCSS3.MD.A.1
CCSS3.MD.A.2
CCSS3.MD.B.3
Formats Included
- PDF
Pages
1 page
Talk Math To Me
2 Followers
Description
Need something to use to help your students analyze and break down word problems? Worry no more! With this CUBES method poster and resource, you can provide students with individual copies, or display it on your math wall. This resource includes images to ensure students of all reading levels and EL levels can independently decipher the meaning behind the CUBES method. Enjoy!
Total Pages
1 page
Answer Key
N/A
Teaching Duration
N/A
Report this resource to TPT
Reported resources will be reviewed by our team. Report this resource to let us know if this resource violates TPT’s content guidelines.
Standards
to see state-specific standards (only available in the US).
CCSS2.MD.B.5
Use addition and subtraction within 100 to solve word problems involving lengths that are given in the same units, e.g., by using drawings (such as drawings of rulers) and equations with a symbol for the unknown number to represent the problem.
CCSS2.MD.C.8
Solve word problems involving dollar bills, quarters, dimes, nickels, and pennies, using $ and ¢ symbols appropriately. Example: If you have 2 dimes and 3 pennies, how many cents do you have?
CCSS3.MD.A.1
Tell and write time to the nearest minute and measure time intervals in minutes. Solve word problems involving addition and subtraction of time intervals in minutes, e.g., by representing the problem on a number line diagram.
CCSS3.MD.A.2
Measure and estimate liquid volumes and masses of objects using standard units of grams (g), kilograms (kg), and liters (l). Add, subtract, multiply, or divide to solve one-step word problems involving masses or volumes that are given in the same units, e.g., by using drawings (such as a beaker with a measurement scale) to represent the problem.
CCSS3.MD.B.3
Draw a scaled picture graph and a scaled bar graph to represent a data set with several categories. Solve one- and two-step “how many more” and “how many less” problems using information presented in scaled bar graphs. For example, draw a bar graph in which each square in the bar graph might represent 5 pets.


