TPT
Total:
$0.00

Uneven Distribution of Natural Resources Activity Analyze Maps Graphs MS-ESS3-1

Rated 4.83 out of 5, based on 64 reviews
4.8 (64 ratings)
;
Flying Colors Science
4.7k Followers
Grade Levels
7th - 10th
Resource Type
Standards
Formats Included
  • PDF
  • Google Apps™
Pages
14 pages
$5.99
$5.99
Share this resource
Report this resource to TPT
Flying Colors Science
4.7k Followers
Includes Google Apps™
The Teacher-Author indicated this resource includes assets from Google Workspace (e.g. docs, slides, etc.).
Easel Activity Included
This resource includes a ready-to-use interactive activity students can complete on any device.  Easel by TPT is free to use! Learn more.

What educators are saying

I loved this. My students need practice in reading graphs, and drawing information from graphs and charts, and that is what this tool does. Excellent!!!!
I used this as a stations activity where students moved at their own pace in small groups or individually. This was great practice on interpreting graphs and data, and students were engaged the entire time they were working. Thanks!
Also included in
  1. Never search for "something to do tomorrow" ever again! This bundle contains PRINT AND GO lessons, NO PREP activities, LOW PREP labs, and ENGAGING articles to supplement and thoroughly enhance an Earth and space science course. Every included resource is easy to implement, standards-based, and high-
    Price $399.99Original Price $639.06Save $239.07
  2. SAVE MORE THAN 30% on a complete activity-based Uneven Distribution of Natural Resources lesson unit! This bundle includes every resource you need to teach and assess NGSS MS-ESS3-1. All of the work has been done for you - from start to finish!These 7 resources form a COMPLETE AND COMPREHENSIVE UNIT
    Price $19.99Original Price $29.44Save $9.45
  3. SAVE 35% off list prices! Engage students with CRITICAL THINKING as you teach them about how humans have impacted ecosystems around the world. The 12 included resources provide fun, NGSS-based activities for each of the following topics:Habitat Destruction Overharvested ResourcesInvasive SpeciesWat
    Price $39.99Original Price $62.90Save $22.91

Description

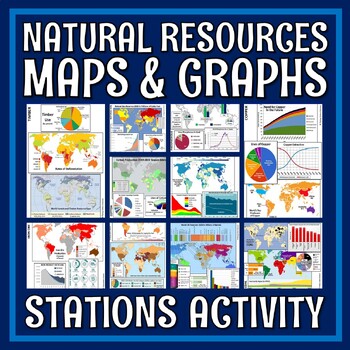
Great way to practice data analysis as students learn about natural resources! Students analyze MAPS and GRAPHS of natural resource distribution and use. Includes both PRINT and GOOGLE SLIDES versions of the activity.

Find this activity in our DISTRIBUTION OF NATURAL RESOURCES UNIT!

This document includes:

  • 10 Natural Resource Data Stations: Each station has maps and graphs to analyze for information such as resource distribution, use, risk of depletion, and impact on the environment. Each station focuses on just one natural resource at a time.
  • Student Sheet: This worksheet asks questions that guide students through examining the data at each station.

EASY PREP and easy to assign!

Only 1 color copy per station is required (10 color pages total). Students can circulate throughout the stations, so there is no need to make color copies for each student. Each student or group needs one black-and-white answer sheet each.

10 Natural Resources Included: iron ore, natural gas, oil, coal, cotton, timber, fish, phosphorous, water, copper

Teacher Notes:

  • Answer key is included.
  • Please note that this resource is not editable.
  • GO PAPERLESS! Use the included digital Google Slides version.
  • NGSS Standard: MS-ESS3-1
  • NGSS Science & Engineering Practice: Analyzing and interpreting data
  • Save $$$ with our DISTRIBUTION OF NATURAL RESOURCES UNIT!

⭐⭐⭐ Click here to get 5 FREE EARTH & SPACE SCIENCE lessons! ⭐⭐⭐

Total Pages
14 pages
Answer Key
Included
Teaching Duration
N/A
Report this resource to TPT
Reported resources will be reviewed by our team. Report this resource to let us know if this resource violates TPT’s content guidelines.

Standards

to see state-specific standards (only available in the US).
NGSSMS-ESS3-1
Construct a scientific explanation based on evidence for how the uneven distributions of Earth’s mineral, energy, and groundwater resources are the result of past and current geoscience processes. Emphasis is on how these resources are limited and typically non-renewable, and how their distributions are significantly changing as a result of removal by humans. Examples of uneven distributions of resources as a result of past processes include but are not limited to petroleum (locations of the burial of organic marine sediments and subsequent geologic traps), metal ores (locations of past volcanic and hydrothermal activity associated with subduction zones), and soil (locations of active weathering and/or deposition of rock).
NGSSHS-ESS3-3
Create a computational simulation to illustrate the relationships among the management of natural resources, the sustainability of human populations, and biodiversity. Examples of factors that affect the management of natural resources include costs of resource extraction and waste management, per-capita consumption, and the development of new technologies. Examples of factors that affect human sustainability include agricultural efficiency, levels of conservation, and urban planning. Assessment for computational simulations is limited to using provided multi-parameter programs or constructing simplified spreadsheet calculations.
NGSSHS-ESS3-1
Construct an explanation based on evidence for how the availability of natural resources, occurrence of natural hazards, and changes in climate have influenced human activity. Examples of key natural resources include access to fresh water (such as rivers, lakes, and groundwater), regions of fertile soils such as river deltas, and high concentrations of minerals and fossil fuels. Examples of natural hazards can be from interior processes (such as volcanic eruptions and earthquakes), surface processes (such as tsunamis, mass wasting and soil erosion), and severe weather (such as hurricanes, floods, and droughts). Examples of the results of changes in climate that can affect populations or drive mass migrations include changes to sea level, regional patterns of temperature and precipitation, and the types of crops and livestock that can be raised.
NGSSMS-ESS3-4
Construct an argument supported by evidence for how increases in human population and per-capita consumption of natural resources impact Earth’s systems. Examples of evidence include grade-appropriate databases on human populations and the rates of consumption of food and natural resources (such as freshwater, mineral, and energy). Examples of impacts can include changes to the appearance, composition, and structure of Earth’s systems as well as the rates at which they change. The consequences of increases in human populations and consumption of natural resources are described by science, but science does not make the decisions for the actions society takes.

Reviews

Questions & Answers

4.7k Followers