TPT
Total:
$0.00

Two Homeostasis Graphing Activities

Rated 4.67 out of 5, based on 6 reviews
4.7 (6 ratings)
;
The Dr B Biology Shop
47 Followers
Grade Levels
10th - 12th, Higher Education, Adult Education, Homeschool
Standards
Formats Included
  • PDF
Pages
13 pages
$2.50
$2.50
Share this resource
Report this resource to TPT
The Dr B Biology Shop
47 Followers

What educators are saying

Great resource. Easy to use and pupils all enjoyed. Those Standards are not part of our syllabus requirements
Students quickly made connections and the graphing practice allowed them to visualize the connections.

Description

These two paper and pencil activities are aimed at high school and introductory college level. They can be used as homework, for individual work, or for small group work.

Homeostasis During Exercise: Using a table of physiological measurements taken on a human subject during exercise, students graph and compare interacting changes (body temperature and perspiration; breathing rate and blood oxygen saturation; heart rate and blood pressure) and draw conclusions about negative feedback mechanisms.

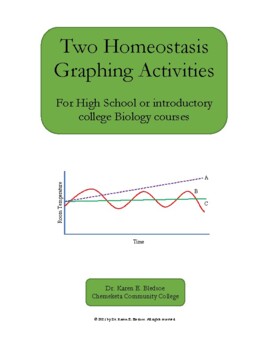
Understanding negative vs positive feedback: Students interpret a graph of a thermostat over time to understand a negative feedback system. They graph blood clotting protein and estrogen to see how positive feedback systems work. Finally, students interpret a complex graph of the interaction between blood sugar and insulin.

Total Pages
13 pages
Answer Key
Included
Teaching Duration
90 minutes
Report this resource to TPT
Reported resources will be reviewed by our team. Report this resource to let us know if this resource violates TPT’s content guidelines.

Standards

to see state-specific standards (only available in the US).
Determine the meaning of symbols, key terms, and other domain-specific words and phrases as they are used in a specific scientific or technical context relevant to grades 9–10 texts and topics.
Analyze the structure of the relationships among concepts in a text, including relationships among key terms (e.g., force, friction, reaction force, energy).
Translate quantitative or technical information expressed in words in a text into visual form (e.g., a table or chart) and translate information expressed visually or mathematically (e.g., in an equation) into words.
Determine the meaning of symbols, key terms, and other domain-specific words and phrases as they are used in a specific scientific or technical context relevant to grades 11–12 texts and topics.
Synthesize information from a range of sources (e.g., texts, experiments, simulations) into a coherent understanding of a process, phenomenon, or concept, resolving conflicting information when possible.

Reviews

Questions & Answers