TPT
Total:
$0.00

"Twisted" Percent Activity How Candy Canes Made w/ video! % Change & Error

;
Teach-On Teacher
40 Followers
Grade Levels
6th - 8th
Standards
Formats Included
  • PDF
Pages
6 pages
$2.40
$2.40
Share this resource
Report this resource to TPT
Teach-On Teacher
40 Followers
Easel Activity Included
This resource includes a ready-to-use interactive activity students can complete on any device.  Easel by TPT is free to use! Learn more.

Description

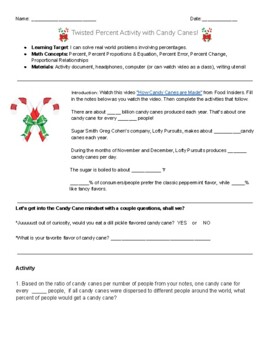
A fun, real world percent project! Answer key included.

Based on the video "How Candy Canes are Made" from Food Insiders. This hook takes students right into an activity/project that involves percent proportion and equation, percent change, percent error, and a proportional relationships extension problem. Students will use information from the video to answer percent problems where they find the percent, the whole, and the part! This is a great culminating activity, summative assessment, or interim assessment.

There is an Easel digital format included as well! This can be completed as a whole group activity, group assignment, or independent work. No prep needed once assigned! I also have fun graphic organizers listed for percent proportion and equations. If you would like the supplemental materials, please take a look!

This is great for any time of the year, but I love it as a holiday project! Keeps them busy before winter break! Though this is a candy themed activity, actual candy is not necessary for this project.

Thank you so much for taking a look at this activity!

Total Pages
6 pages
Answer Key
Included
Teaching Duration
1 hour
Report this resource to TPT
Reported resources will be reviewed by our team. Report this resource to let us know if this resource violates TPT’s content guidelines.

Standards

to see state-specific standards (only available in the US).
Find a percent of a quantity as a rate per 100 (e.g., 30% of a quantity means 30/100 times the quantity); solve problems involving finding the whole, given a part and the percent.
Recognize and represent proportional relationships between quantities.
Decide whether two quantities are in a proportional relationship, e.g., by testing for equivalent ratios in a table or graphing on a coordinate plane and observing whether the graph is a straight line through the origin.
Use proportional relationships to solve multistep ratio and percent problems. Examples: simple interest, tax, markups and markdowns, gratuities and commissions, fees, percent increase and decrease, percent error.
Make sense of problems and persevere in solving them. Mathematically proficient students start by explaining to themselves the meaning of a problem and looking for entry points to its solution. They analyze givens, constraints, relationships, and goals. They make conjectures about the form and meaning of the solution and plan a solution pathway rather than simply jumping into a solution attempt. They consider analogous problems, and try special cases and simpler forms of the original problem in order to gain insight into its solution. They monitor and evaluate their progress and change course if necessary. Older students might, depending on the context of the problem, transform algebraic expressions or change the viewing window on their graphing calculator to get the information they need. Mathematically proficient students can explain correspondences between equations, verbal descriptions, tables, and graphs or draw diagrams of important features and relationships, graph data, and search for regularity or trends. Younger students might rely on using concrete objects or pictures to help conceptualize and solve a problem. Mathematically proficient students check their answers to problems using a different method, and they continually ask themselves, "Does this make sense?" They can understand the approaches of others to solving complex problems and identify correspondences between different approaches.

Reviews

Questions & Answers

40 Followers