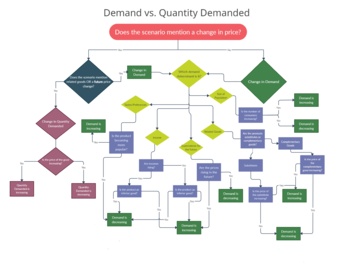
Supply and Demand - Graphing Changes in Demand/Quantity Demanded Flow Chart
143 Downloads
Katherine McCoy
0 Followers
Grade Levels
6th - 12th
Subjects
Resource Type
Formats Included
- Jpeg
Pages
1 page
Katherine McCoy
0 Followers
Description
Help students with their thought process as they learn to differentiate between quantity demanded and demand. This flow chart shows the end result of price changes, as well as each of the determinants/shifters of demand.
This flow chart will fit perfectly on a 8.5 x 11 piece of paper. You can make copies for each student individually, upload the digital version to a digital classroom, and/or use the file to make a poster for your classroom!
Total Pages
1 page
Answer Key
N/A
Teaching Duration
N/A
Report this resource to TPT
Reported resources will be reviewed by our team. Report this resource to let us know if this resource violates TPT’s content guidelines.


