
Statistics Unit Grade 6 - Mean - Median - Mode - Histograms - Box Plots


- Zip
- Google Apps™

Also included in
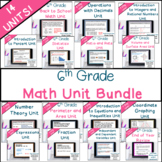 Don't have time to plan your math lessons? We have what you need! Try our 6th Grade Math Curriculum Bundle. It contains 14 NO PREP Units and an End-of-Year Review. The units are very easy to use and will save you a lot of time! Review important math concepts with your students by using our editablePrice $145.00Original Price $182.00Save $37.00
Description
Make lesson planning easy with this no-prep Statistics - Mean, Median, Mode - Histograms - Box Plots Unit! Included are 9 ready-made lessons to teach finding the mean, median, and mode as well as interpreting and creating dot plots, histograms, and box-and-whisker plots. This unit is very easy to use and will save you a lot of time!
Your students will learn how to find mean, median, and mode and interpret box-and-whisker plots by using our editable PowerPoints with guided notes. Students will love learning about dot plots and histograms when you use the included activities for each lesson!
Lessons Included in Statistics Unit Grade 6 - Mean, Median, Mode - Histograms - Box Plots
1). Statistical Questions
2). Mean, Median, Mode
3). Dot Plots
4). Mean Absolute Deviation
5). Histograms
6). Measures of Variation
7). Box-and-Whisker Plots
8). Statistics Test Review
9). Statistics Test
Click the link below for a FREE sample lesson on Integers from the 6th Grade Introduction to Integers and Rational Numbers Unit. It includes a PowerPoint as well as an activity and a practice sheet.
Included in Statistics Unit Grade 6 - Mean, Median, Mode - Histograms - Box Plots
- Editable PowerPoints for each lesson (see the list of lessons below).
- Each PowerPoint has a warm-up, notes, and a lesson closure.
- Editable Guided Notes and/or flippables for each PowerPoint Lesson.
- Activities for each lesson.
- Editable Practice Sheets for each lesson.
- Test Review Activity for the unit.
- Editable Test for the unit.
- Answer keys are included.
- Individual PDFs of guided notes, practice sheets, and activities are also provided if you would like to use the lesson digitally.
- For use with Google- The PowerPoints, guided notes, activities, and practice sheets also have a version in Google Slides to be used for digital learning.
This Statistics Unit Grade 6 - Mean, Median, Mode - Histograms - Box Plots makes planning your math lessons a breeze! Your students will be engaged in math class by moving around and working with others while playing games and solving puzzles.
Lesson Planning is quick and easy! Use the mean, median, and mode, histograms, and box-and-whisker plot PowerPoint lessons provided along with the guided notes. You also have an activity and practice sheet for the lesson that you can print. Just gather the materials you need for the day and you are ready to go!
If you have access to technology and would like to reduce paper use with your students we have all of the materials available as a Google Slide that students can use.
Hear What Teachers are Saying about Statistics Unit Grade 6 - Mean, Median, Mode - Histograms - Box Plots!
⭐️⭐️⭐️⭐️⭐️ My students were engaged and worked hard on this activity! I was really happy to see them enjoy learning! I completely recommend! -Hope S.
⭐️⭐️⭐️⭐️⭐️ My students LOVED this resource. I made it into a booklet for the students to work on. We would take the notes and then they had practice time with each part. It was great! -Nicole F.
⭐️⭐️⭐️⭐️⭐️Super product! Great for practice and assessment. I used it to supplement our math curriculum, kids were very engaged! -Donna S.
⭐️⭐️⭐️⭐️⭐️ It is an excellent resource for my six-grade students; I would recommend it in other six-grade classrooms. -Ashley T.
⭐️⭐️⭐️⭐️⭐️Students enjoyed the activities and the standards were broken down easily for them to understand. -Heather H.
___________________________________
For Sixth Grade Math Units
For Seventh Grade Math Units
For Eighth Grade Math Units
You may also like…
→Mean, Median, and Mode Scavenger Hunt
→6th Grade Statistics Summer Escape
Be sure to follow the Teacher Twins store for new products! CLICK HERE
___________________________________
Copyright © Teacher Twins
Permission to copy for single classroom use only.
Please purchase additional licenses if you intend to share this product.
