TPT
Total:
$0.00

Statistics Unit 6 Bundle - Discrete Probability (12 days)

Rated 5 out of 5, based on 4 reviews
5.0 (4 ratings)
;
Mountainworks Education
61 Followers
Grade Levels
9th - 12th, Higher Education
Subjects
Standards
Formats Included
  • Zip
Pages
68 pages
$12.75
$12.75
Share this resource
Report this resource to TPT
Mountainworks Education
61 Followers

Description

This is a unit plan bundle for a Statistics class. The plans include common core math standards, time frame, activities, enduring understandings, essential questions, and resources used. It is designed to last 12 days, depending on pacing. The plans include:

39-slide presentation, with annotated guide for reference

3 Worksheets

"Do Now" Entrance problems

2 quizzes

Spreadsheet Activity - Binomial, Geometric, Poisson Disributions

Review slides (for student-group communicators)

Unit test (with review packet)

Pacing Guide with administrative unit plan

All with answer keys included

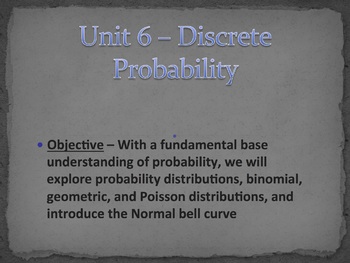
*The topics covered are discrete random variables, mean and standard deviation of a probability distribution, Binomial experiments and the binomial theorem, Geometric distributions, Poisson Distributions, mean and standard deviation of binomial, geometric, and poisson distributions. The documents are Word based, Powerpoint based, Excel Based, pdfs included, and completely editable. Enjoy!

**If you find this product useful, consider buying the bundle "A Mountain of Statistics Curriculum" for the entire class**

***Please read the "readme" text file and End User License Agreement contained in the Product. Thank you for respecting my work***

Total Pages
68 pages
Answer Key
Included
Teaching Duration
3 Weeks
Last updated Apr 27th, 2020
Report this resource to TPT
Reported resources will be reviewed by our team. Report this resource to let us know if this resource violates TPT’s content guidelines.

Standards

to see state-specific standards (only available in the US).
Define a random variable for a quantity of interest by assigning a numerical value to each event in a sample space; graph the corresponding probability distribution using the same graphical displays as for data distributions.
Calculate the expected value of a random variable; interpret it as the mean of the probability distribution.
Develop a probability distribution for a random variable defined for a sample space in which theoretical probabilities can be calculated; find the expected value. For example, find the theoretical probability distribution for the number of correct answers obtained by guessing on all five questions of a multiple-choice test where each question has four choices, and find the expected grade under various grading schemes.
Develop a probability distribution for a random variable defined for a sample space in which probabilities are assigned empirically; find the expected value. For example, find a current data distribution on the number of TV sets per household in the United States, and calculate the expected number of sets per household. How many TV sets would you expect to find in 100 randomly selected households?
Evaluate and compare strategies on the basis of expected values. For example, compare a high-deductible versus a low-deductible automobile insurance policy using various, but reasonable, chances of having a minor or a major accident.

Reviews

Questions & Answers