Statistics | Guided Notes | Mean | Median | Mode | Range | Math | Data Analysis
- PDF
Description
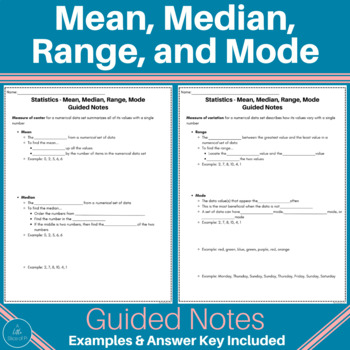
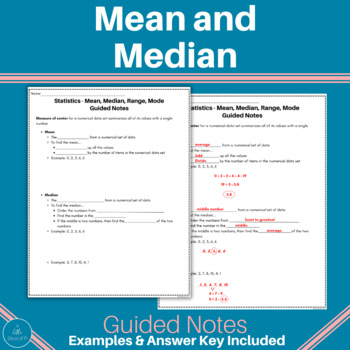
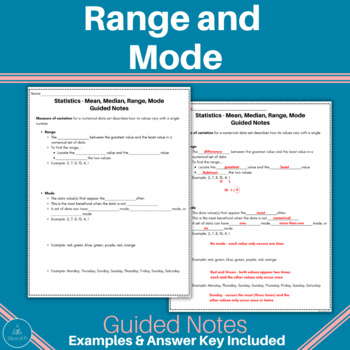
Students learning about mean, median, range, and mode? These fill in the blank guided notes will be a great addition to your math classroom. This resource is made to be very easy for your students to follow along with you and it also gives them step by step directions. It is important students know and understand measures of center and measures of variation and these guided notes will help show which ones show the center of their data versus the variation of their data. Examples are included with all! This resource will be great for your students to refer back to at any point during their statistics unit. The statistics guided notes will integrate very easily in a sixth grade classroom but can also be used in other grade levels when doing data analysis. Teacher answer key included!
What’s included:
- Statistics - Mean, Median, Range, Mode Fill in the Blank Guided Notes
- Teacher Answer Key
Use year after year!
- Fill in the blank guided notes allow students to follow right alongside you during any direct instruction days
- Students have their own resource to refer back to
- Examples included for mean, median, range, and mode
Check out more 6th grade materials from my store! CLICK HERE
Thanks for visiting my store! I hope you come again soon :)
Andrea Schmidt
Instagram:alittlesliceofpi</a>
Did you know you can earn TPT $ as store credit just by leaving feedback?
Here's how:
- Go to the “My Purchases” page.
- Use the provide feedback icon under any item you downloaded.
- Click it and you will be able to leave a short comment and rating.
- Each time you provide feedback TPT gives you credits that you may use to lower the cost of any future purchases.
It’s that easy!
Thank you in advance as your feedback is important to me!


