TPT
Total:
$0.00

Shop 'til You Drop: A Money, Graphing & More Project-Based Learning Math Project

Rated 4.5 out of 5, based on 2 reviews
4.5 (2 ratings)
;
Grade Levels
2nd - 5th
Standards
Formats Included
  • PDF
Pages
19 pages
$6.00
List Price:
$8.00
You Save:
$2.00
$6.00
List Price:
$8.00
You Save:
$2.00
Share this resource
Report this resource to TPT

Description

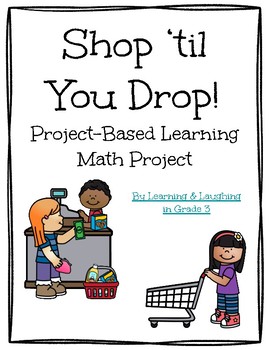
Shop 'til You Drop is a project-based learning math project that incorporates a wide array of standards in one cumulative project that my students always love! Students learn the basics of entrepreneurship as they choose business partners and work together to develop their own "store"! After a "class store" day where students can "purchase" items from their classmates' stores, students use their sales records to create graphs displaying their sales data!

Included in the file:

-Action Plan checklist

-Business Plan

-Store logo design sheet

-Items & Price list

-Store Map (2 copies- one with gridlines to incorporate area & perimeter)

-Advertising poster design sheet

-Sales record sheet

-Sales data graph sheets (2 included- students can create a bar or pie graph)

-$1 bills, $5 bills, and checks for class store (color and B&W copies included)

Total Pages
19 pages
Answer Key
N/A
Teaching Duration
N/A
Report this resource to TPT
Reported resources will be reviewed by our team. Report this resource to let us know if this resource violates TPT’s content guidelines.

Standards

to see state-specific standards (only available in the US).
Solve word problems involving dollar bills, quarters, dimes, nickels, and pennies, using $ and ¢ symbols appropriately. Example: If you have 2 dimes and 3 pennies, how many cents do you have?
Draw a picture graph and a bar graph (with single-unit scale) to represent a data set with up to four categories. Solve simple put-together, take-apart, and compare problems using information presented in a bar graph.
Draw a scaled picture graph and a scaled bar graph to represent a data set with several categories. Solve one- and two-step “how many more” and “how many less” problems using information presented in scaled bar graphs. For example, draw a bar graph in which each square in the bar graph might represent 5 pets.
Recognize area as an attribute of plane figures and understand concepts of area measurement.
A square with side length 1 unit, called “a unit square,” is said to have “one square unit” of area, and can be used to measure area.

Reviews

Questions & Answers